Topology
In LOGINventory it is possible to generate graphical representations of the network. These topology representations can be edited, saved and exported. These graphics show, for example, which device is connected to which port, which virtual machines are running on which host, or where devices are located on a building map.
Tip
All saved drawings can be synchronized directly with changes to the dataset, so that, for example, newly captured devices will also show up in the saved drawings when they are opened in the Topology Editor.
Graphical Representation of Network Connections
Topology representations are available in three different modes:
- Dynamic Topology View is available directly on asset queries as a tab, provides some editing functionality, and can be used as a starting point to persist representations.
- The Topology Viewer shows already created views and offers only the possibilities to filter, to search and to export.
- The Topology Editor offers all available options, shows changes from previous states, allows to store spatial plans and much more.
Dynamic Topology View
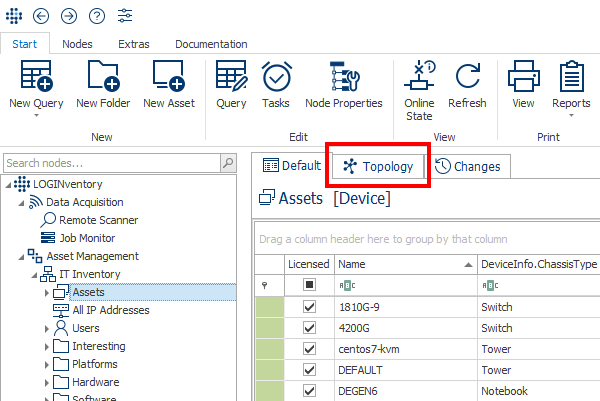
To quickly generate a graphical representation, you can switch to the Topology tab when querying the Device entity (e.g. "Assets" nodes, "Switches" nodes, etc.). Then the result set of this query will be displayed in a graph.
Attention
The display of the network only makes sense if there is at least one switch in the result set of the query for which a MAC address table could be successfully read. Otherwise the devices are connected to an "Unknown Hub".
Important
In order for the changes made here to be saved, the "Save" button in the ribbon menu must be clicked. Thereupon the current graphic is saved and persisted as a node below the node "Topology" in the tree structure for later viewing and editing. 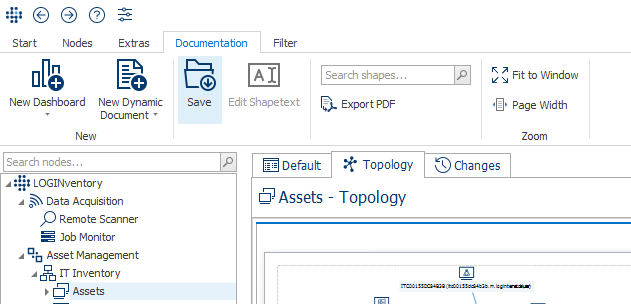 If the view is exited without saving, all changes are discarded and the next time the tab is visited, the topology is regenerated based on the data currently present in the result set.
Info
If assets are selected here or in the Topology Viewer, the known functionalities for storing properties, documents etc. are available via the widgets.
Topology Viewer
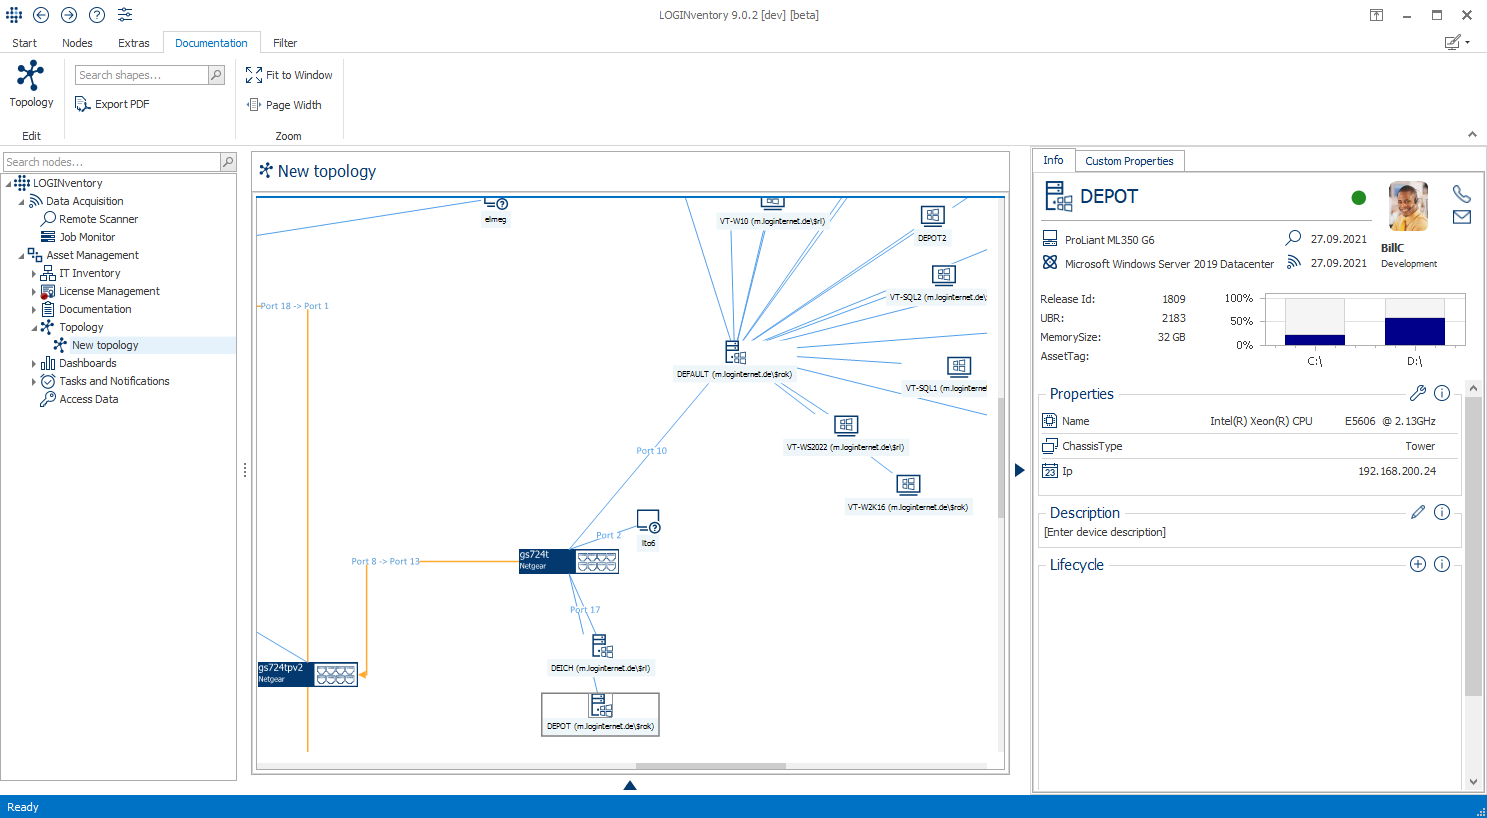
The topology viewer is used to view topology representations that have already been saved in the past. Several representations can be saved below the Topology node, e.g. to save different locations, floors or contents. As soon as one of these nodes is clicked, the topology viewer is opened in the data view.
Topology Editor
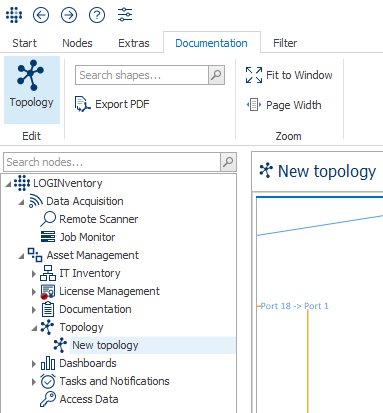
The Topology Editor can be opened for existing topologies below the Topology node by clicking Edit Topology in the Documentation ribbon menu.
In this mode, various adjustments can be made to the topology. The changes are saved by clicking the OK button at the bottom right.
Creation of a New Topology Representation
Two similar options are available to create a new topology representation:
- Navigation to a query with entity Device in the LOGINventory tree structure and opening the Dynamic Topology View: all elements contained in the result set of the query will be inserted into the graph.
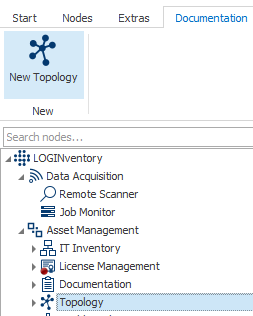
- Navigation to the Topology node and creation using the ribbon menu. This representation will then open directly in the Topology Editor.
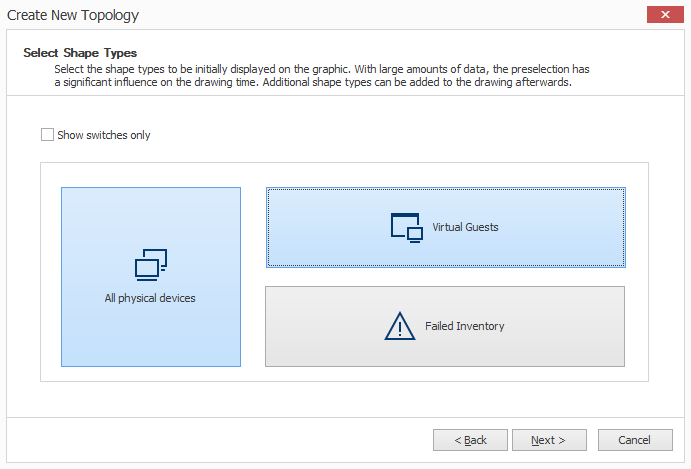
If a new topology is created via the second variant, two more steps follow:
- First, a data source must be selected, to which the new topology should refer, this corresponds quasi to variant 1:
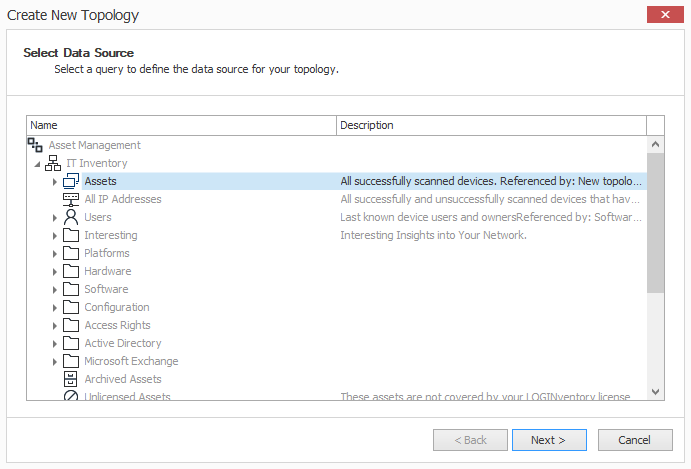
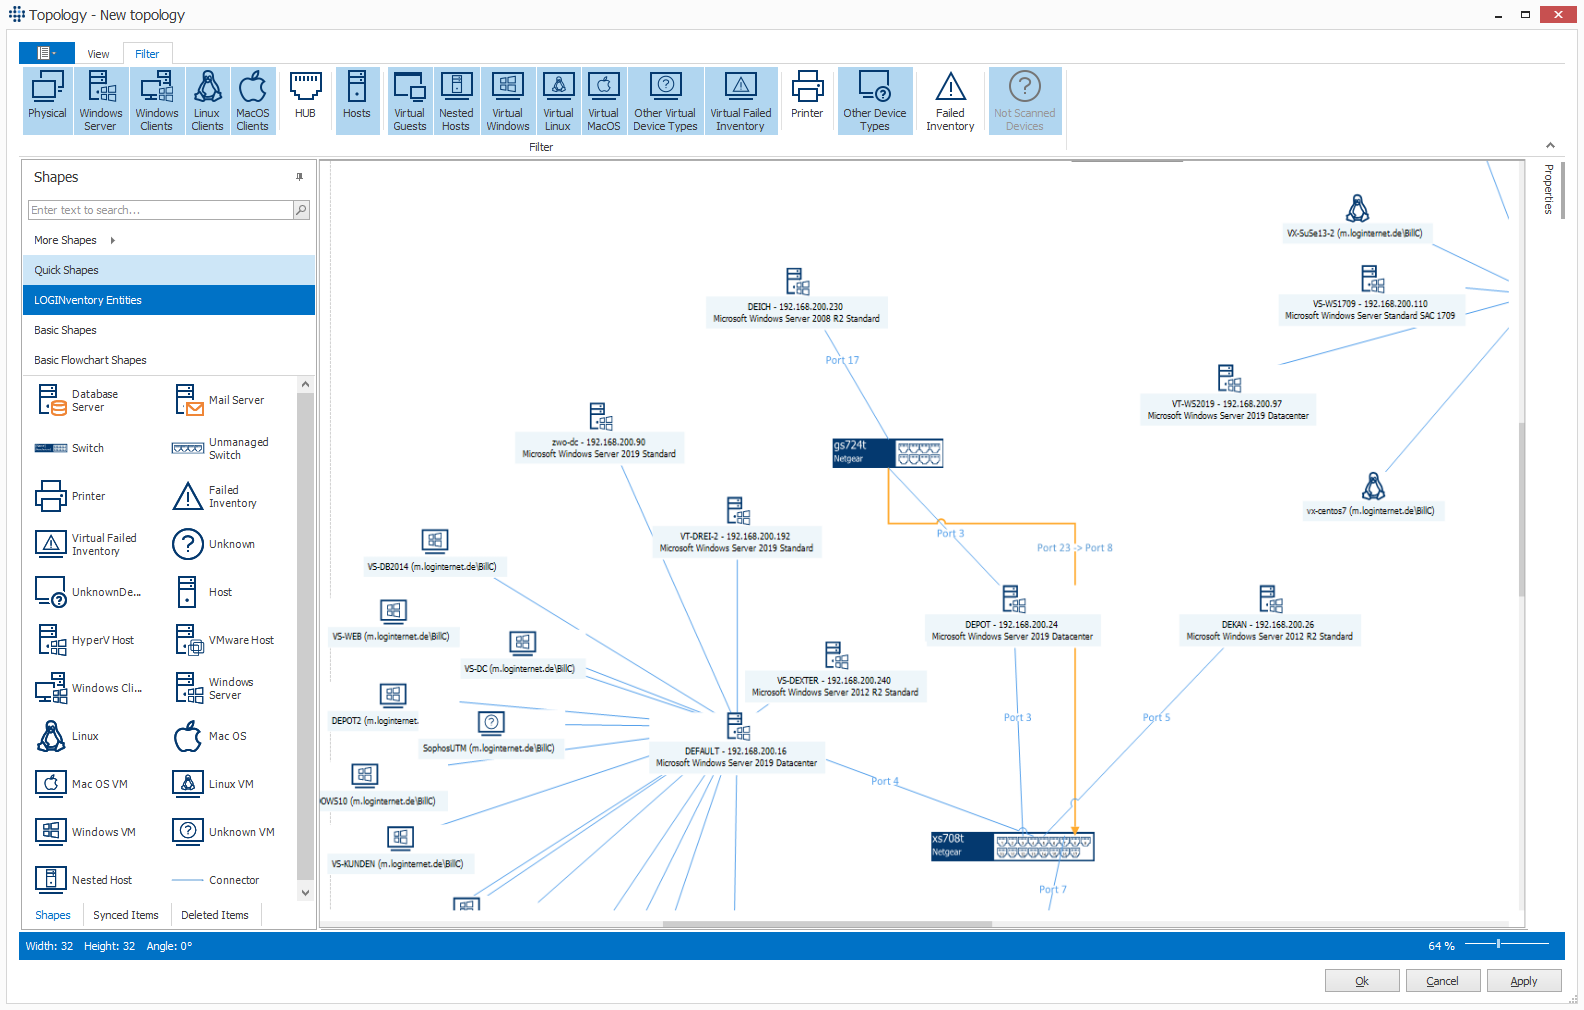
- After that, you can restrict which elements should be present directly on the drawing sheet, e.g. "switches only", "switches and physical devices only", etc. The selection made in the screenshot would ensure that switches, physical devices, as well as virtual machines, but no elements that were inventoried incorrectly (see node Error Analysis) are included on the drawing.
Important
Especially for databases with a lot of assets it can be very useful to restrict the shape type selection, otherwise it can lead to very long loading times.
If certain types have been excluded during the shape type preselection and these are to be added to the drawing afterwards, the button Refresh drawing must be selected in the ribbon menu Filter after further shape types have been selected. This will reload them onto the drawing sheet and they must then either be arranged manually or positioned automatically by Recreating the Shape Layout.
Restricting the Result Set of the Topology Representation
If not all devices, but only specific devices (e.g., those of a location) are to be displayed in a topology representation, a query must first be created that contains the desired result set (e.g., the devices of a location).
Attention
The query used for the topology must always contain at least one switch, as its MAC address table is used to create the connections.
To create the topology representation, you can either navigate to the corresponding query in the tree structure and then use the Dynamic Topology View, or reference the query in the dialog for Creating a New Topology Representation.
Available Functions
Filters
Availability:
| Dynamic View | Topology Viewer | Topology Editor |
|---|---|---|
| ✔️ | ✔️ | ✔️ |
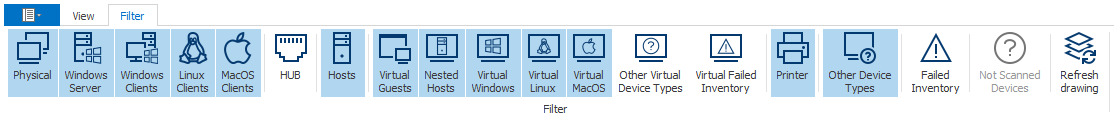
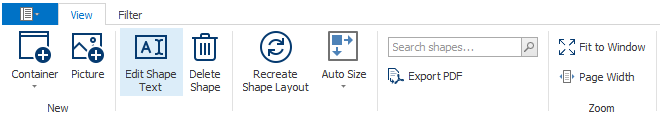
In the Filter ribbon menu, you can select which device types should be visible or hidden on the topology. For example, clicking on Virtual Guests will hide all VMs, or clicking on Virtual Linux will hide only Linux VMs.
The color highlighting always shows which device types are currently displayed.
Important
As long as certain shapes were only hidden, they can be shown again at any time at the same position. However, if the button Recreate Shape Layout in the View ribbon is clicked, all currently hidden shapes will be removed from the drawing area. This is also indicated with a message box.
Recreate Shape Layout
Availability:
| Dynamic View | Topology Viewer | Topology Editor |
|---|---|---|
| ❌ | ❌ | ✔️ |
The initial creation of a topology attempts to position directly connected elements as close to each other as possible while generating no overlaps. However, if certain shape types have been removed or many new shapes have been added, it may be desired to have the shape arrangement completely regenerated.
Attention
This will cause the positions of all shapes to be adjusted by the algorithm. If you have added a room map as a background image, it may make more sense to drag and drop the shape arrangement manually.
Tip
If you want to discard all changes in the topology editor, you can click on the "Cancel" button in the bottom right corner.
Background Image
Availability:
| Dynamic View | Topology Viewer | Topology Editor |
|---|---|---|
| ❌ | ❌ | ✔️ |
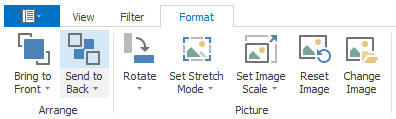
A new image can be added via the View ribbon menu. This is suitable for adding room plans to the topology. These are then sensibly moved to the background via the ribbon menu Format.
Tip
If shapes have already been positioned on the spatial plan, careful consideration should be given before calling an shape layout recreation.
Shape Text
Availability:
| Dynamic View | Topology Viewer | Topology Editor |
|---|---|---|
| ✔️ | ❌ | ✔️ |
All elements in the topology have a description by default. Thus, for successfully detected devices, the name of the device and in brackets (if any) the name of the owner are displayed by default. For unknown devices, the MAC address is shown along with the manufacturer name.
However, this displayed text can be edited. Other fields from the database can be used or free names can be assigned. To change the description of a shape, the shape must be selected on the drawing sheet. Then Edit Shape Text can be selected in the ribbon menu.
A new name pattern can be created in the Shape Text Editor using data fields, functions and free text. It is also possible to set whether this name pattern applies only to the selected shape, to all shapes of the same type (e.g. all Virtual Windows machines) or all devices of the same type (all successfully scanned devices vs. non-scanned devices).
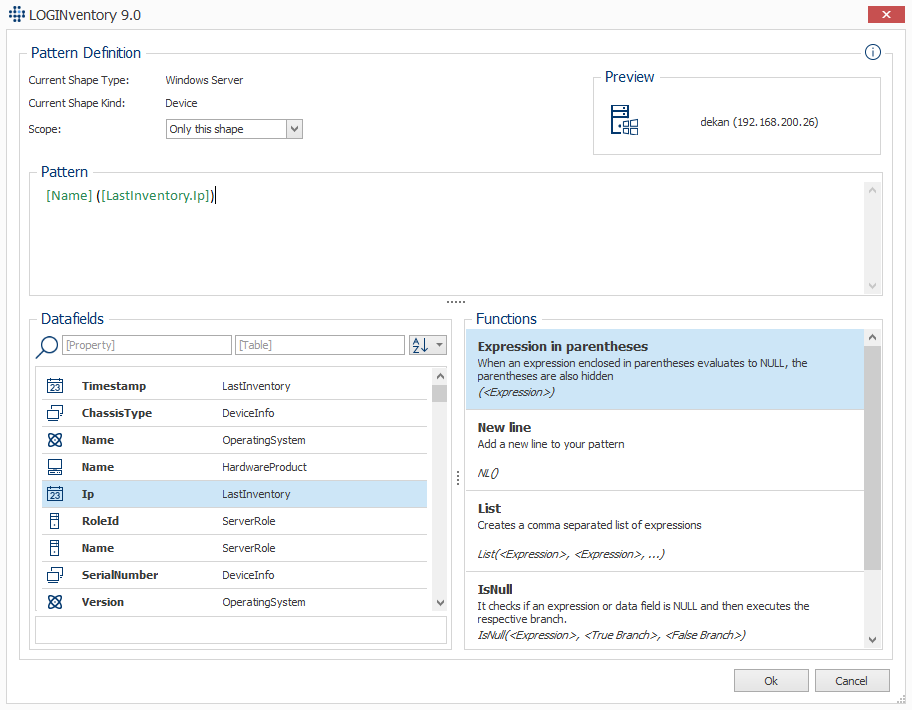
By double-clicking on a function name or data field, it can be added to the naming pattern. There must always be a space between each command / expression.
Example
The expression [Name] ([DeviceInfo.ChassisType]) NL() Add your text here can generate the following description: 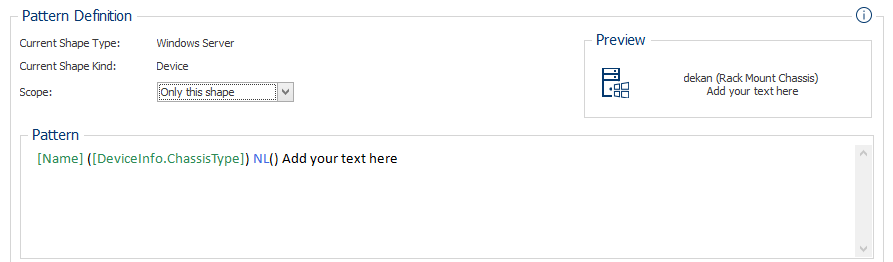
With the IsTrue function more complex conditions can be mapped: If not only a data field is to be checked for true in the condition, but a boolean expression, then this must be written in curly brackets, i.e.
IsTrue({Boolean-Expression}, true-path, false-path)
The boolean expression allows the following syntax:
{ left-Operand [<>|<|>|=] right-Operand }
Operands can be either numbers, strings, data fields or fixed values.
Example
The expression [Name] ([Owner.Name]) NL() IsTrue({ [DeviceInfo.MemorySizeGB] > 4}, lots of memory Speicher, little memory) NL() IsTrue([Custom.Active], active,not active) creates the following text: 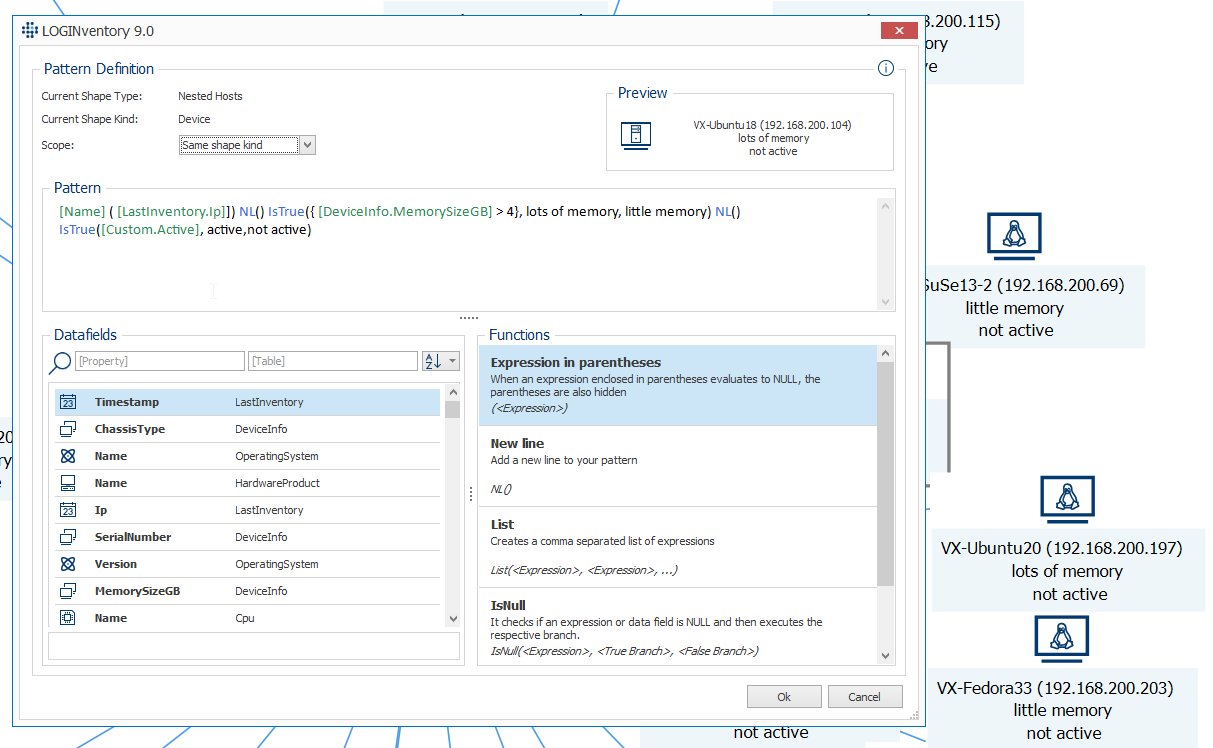
Switch Representation
Availability:
| Dynamic View | Topology Viewer | Topology Editor |
|---|---|---|
| ❌ | ❌ | ✔️ |
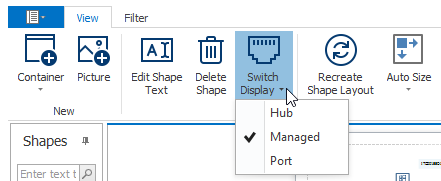
If a switch has been selected in the graphic, the button can be used to change the display of a switch. You can switch between the small representation as hub, the medium representation as "managed" switch (managed) and the port representation.
In the Port display, an attempt is made automatically to calculate the correct number of available ports. If this number is not correct, the number of ports and rows can be adjusted manually in the Properties window under "Miscellaneous".
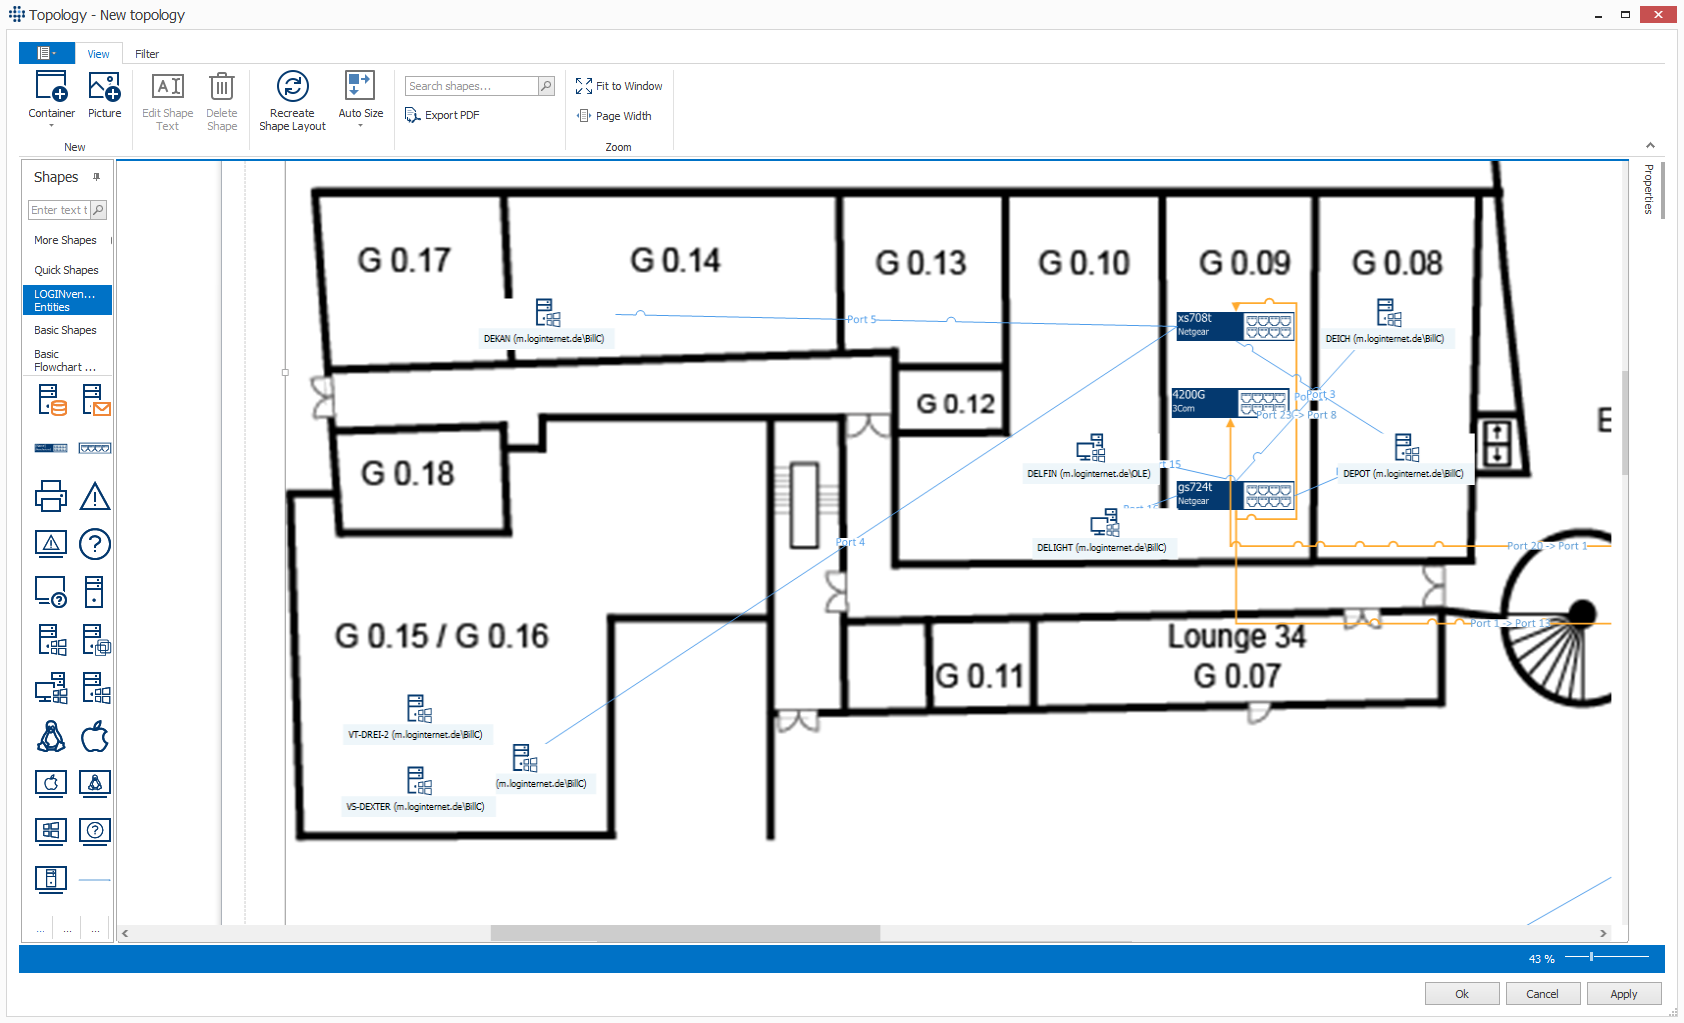
Example
The three different modes were selected in this example: 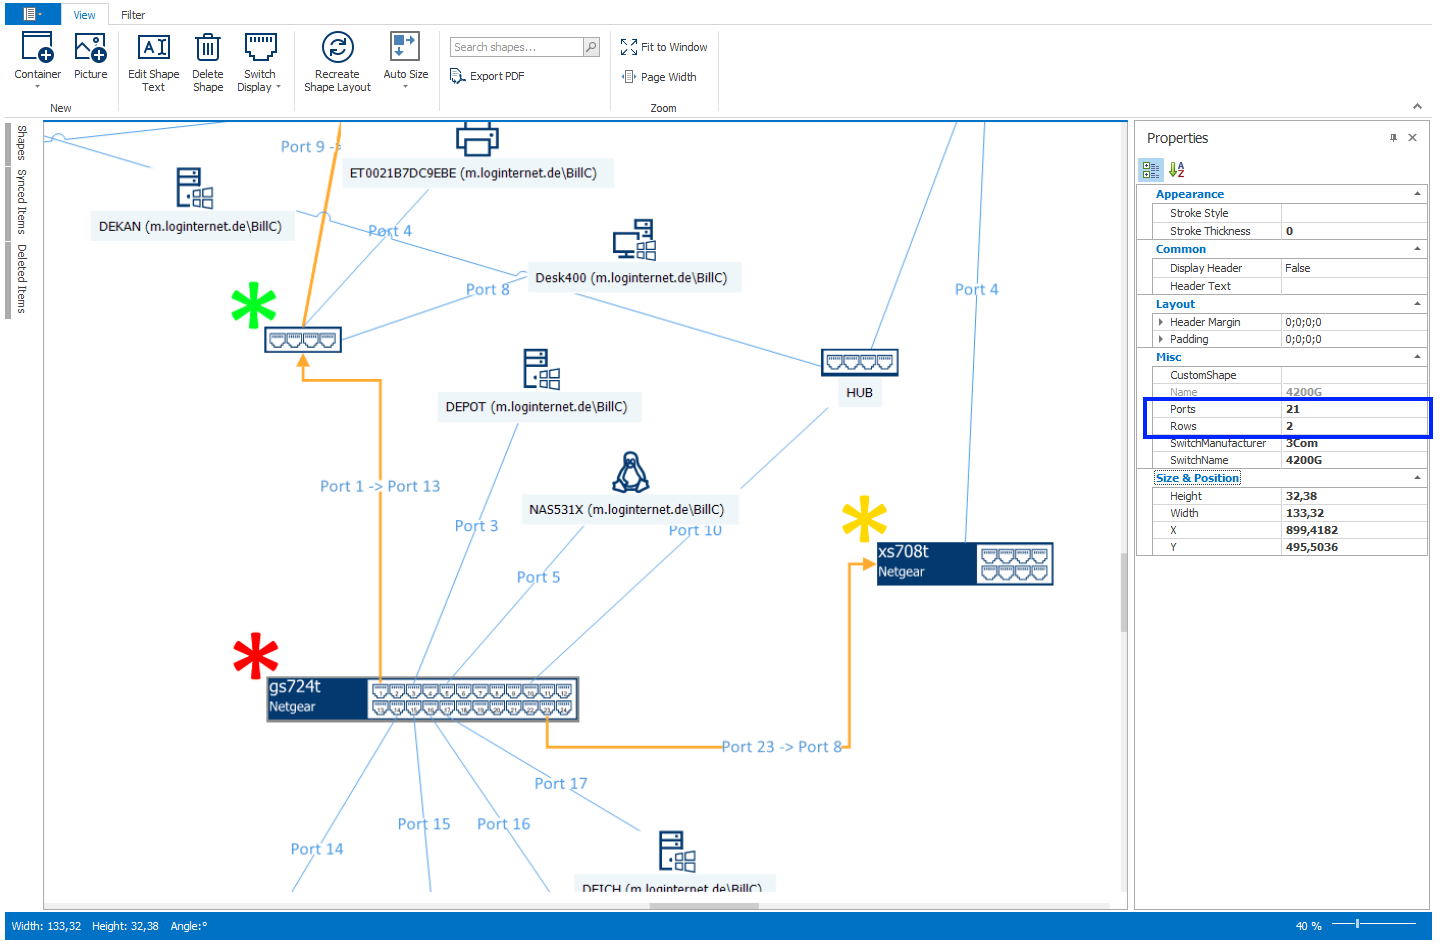 The 1st switch (green asterisk) is in Hub mode, the second in Port mode (red asterisk), the third in Managed mode (yellow asterisk). Also, the option to set the port number and rows is highlighted in blue.
Changing Shape Representations
Availability:
| Dynamic View | Topology Viewer | Topology Editor |
|---|---|---|
| ❌ | ❌ | ✔️ |
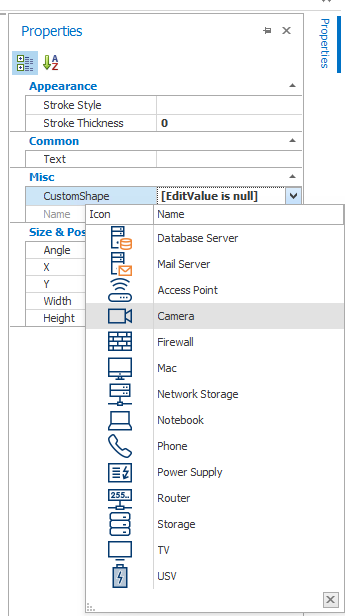
If a shape has been selected in the graphic, a different shape representation can be selected via the properties:
VLAN Information
Availability:
| Dynamic View | Topology Viewer | Topology Editor |
|---|---|---|
| ✔️ | ❌ | ✔️ |
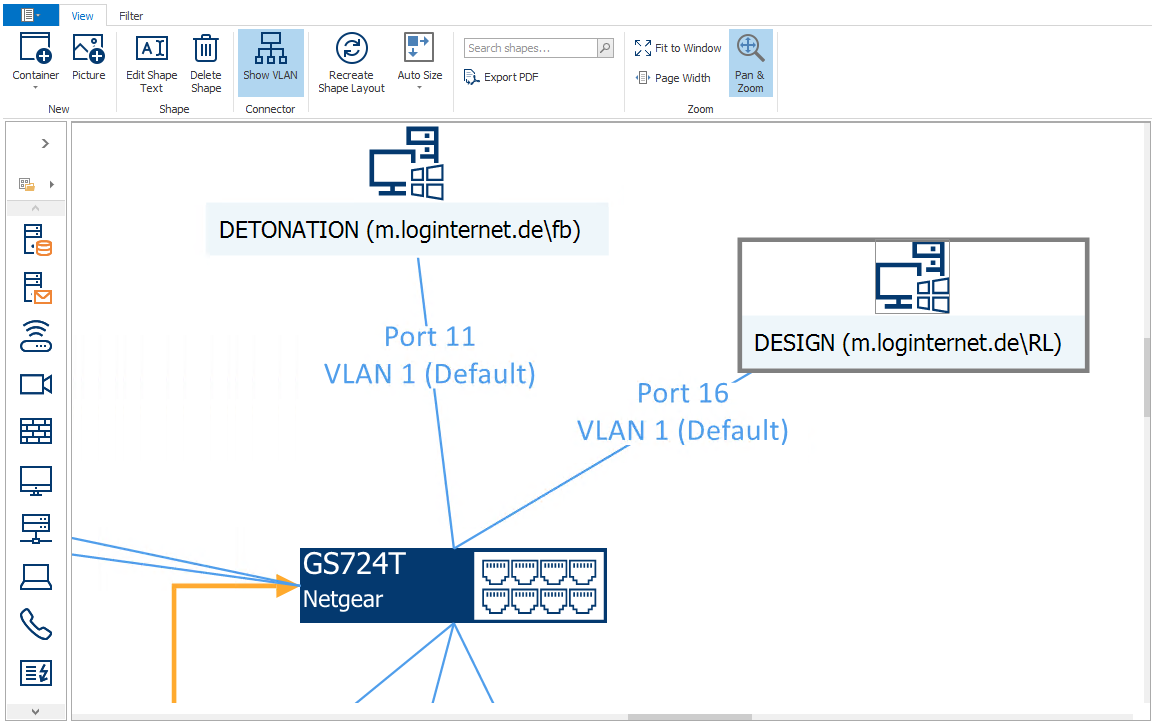
The ribbon menu can be used to select whether not only the port but also VLAN information should be displayed for connections between devices.
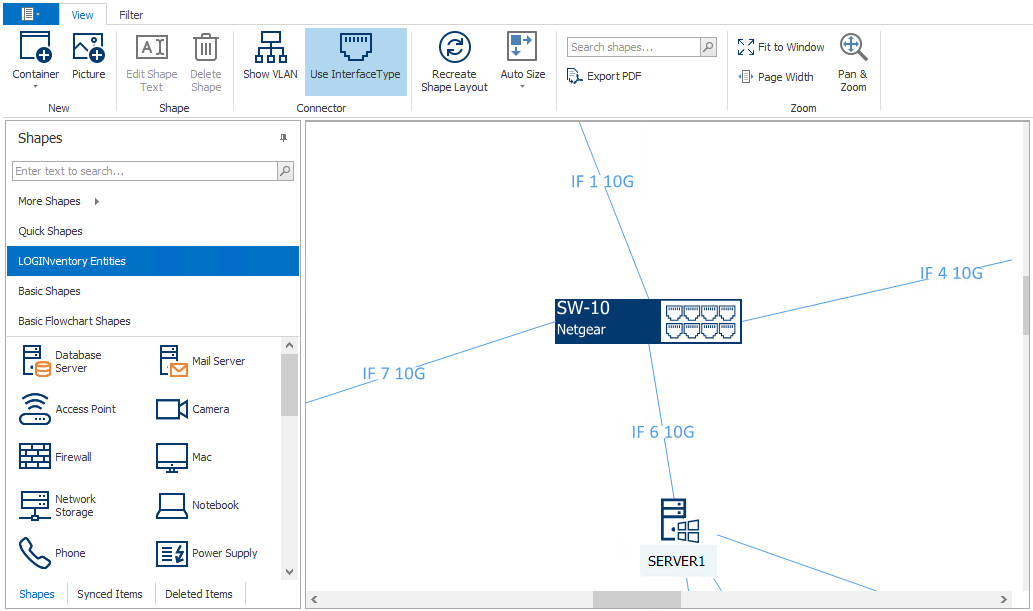
Interface Type
Availability:
| Dynamic View | Topology Viewer | Topology Editor |
|---|---|---|
| ✔️ | ❌ | ✔️ |
Instead of labeling a connection with the port name, the interface type can alternatively be displayed. This setting is particularly useful when the logical port numbers are not meaningful, for example, with stacked switches.
Highlighting of Changes
Availability:
| Dynamic view | Topology viewer | Topology editor |
|---|---|---|
| ❌ | ❌ | ✔️ |
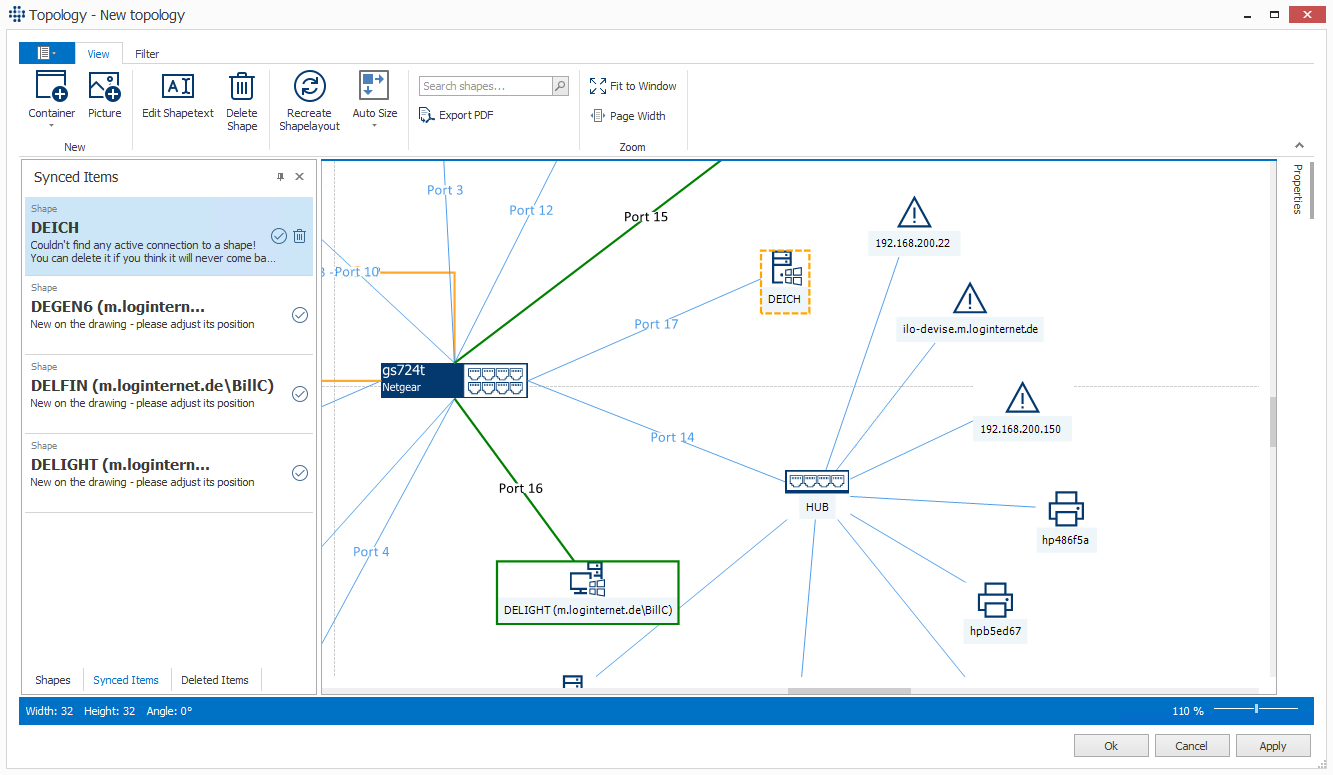
When the topology editor is opened, the saved graphic is compared with the current dataset and any changes are highlighted graphically:
| Change | Description | Sample Image |
|---|---|---|
| New Shape | Green bordered shapes are drawn when elements are generally new on the drawing (e.g. because they were captured for the first time, or by adding a hidden shape type again (see Filters). | 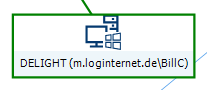 |
| New Connection | Green connections are drawn if it is a completely new connection (a connection that has not been on the drawing sheet before - often used in conjunction with "New Shape"). | 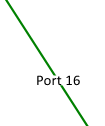 |
| Changed Connection | The connection is drawn green dashed when a connection was changed / reassigned (e.g. device was connected to another port or switch). | 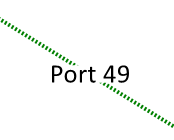 |
| Disconnected Connection | Orange dashed shapes are drawn if the shape was found, but no connection to the previously connected switch exists anymore ( e.g. laptop was unplugged, switch was scanned afterwards). |  |
Info
If a device has been successfully scanned in the past and then deleted from the database, this device is now shown in the topology as "Not scanned device": The information about the connection between switch and MAC address is still available, but no more data is known for this MAC address.
All newly added shapes appear in the Synced items menu. By selecting an entry, the focus is set on this shape on the drawing sheet and the position can be adjusted if required. Clicking on the checkmark in this menu "confirms" the new position and removes the entry from the Synced Items list.
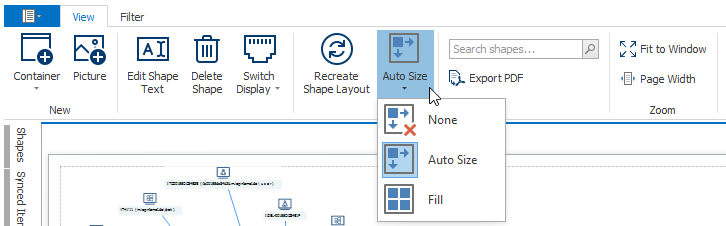
Auto Size
Availability:
| Dynamic View | Topology Viewer | Topology Editor |
|---|---|---|
| ❌ | ❌ | ✔️ |
Depending on the selection at Auto-Size, the size of the drawing sheet dynamically adjusts to the positions of the shapes to be displayed.
Search
Availability:
| Dynamic View | Topology Viewer | Topology Editor |
|---|---|---|
| ✔️ | ✔️ | ✔️ |
The name of a device can be entered via the search window. If a result line is selected from the suggestion list, the system zooms directly to the selected device and highlights it. In this way, devices can be identified quickly and easily even in large, unclear topology displays.
Export
Availability:
| Dynamic View | Topology Viewer | Topology Editor |
|---|---|---|
| ✔️ | ✔️ | ✔️ |
The topology view can be exported to PDF format using this function.
Shapes
Availability:
| Dynamic View | Topology Viewer | Topology Editor |
|---|---|---|
| ❌ | ❌ | ✔️ |
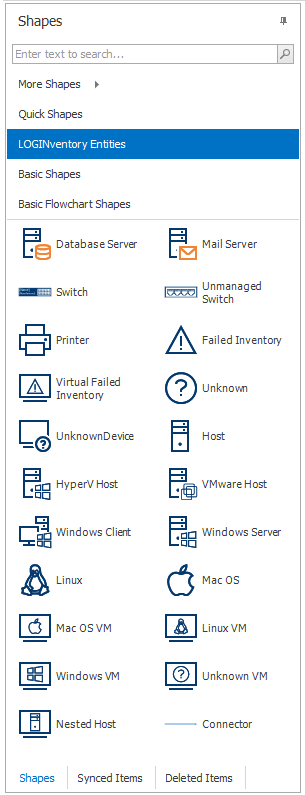
In the left menu Shapes different shape types are available, which can be dragged and dropped onto the drawing sheet. Likewise, the type "Connector" can also be selected to connect shapes on the drawing sheet.
Properties
Availability:
| Dynamic View | Topology Viewer | Topology Editor |
|---|---|---|
| ❌ | ❌ | ✔️ |
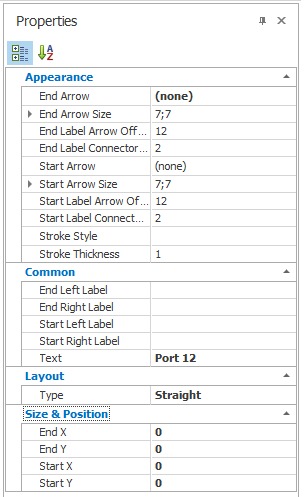
Depending on the selected element (shape or connection), different options are available in the Properties menu to further customize the appearance of the elements.
Deleted Items
Availability:
| Dynamic View | Topology Viewer | Topology Editor |
|---|---|---|
| ❌ | ❌ | ✔️ |
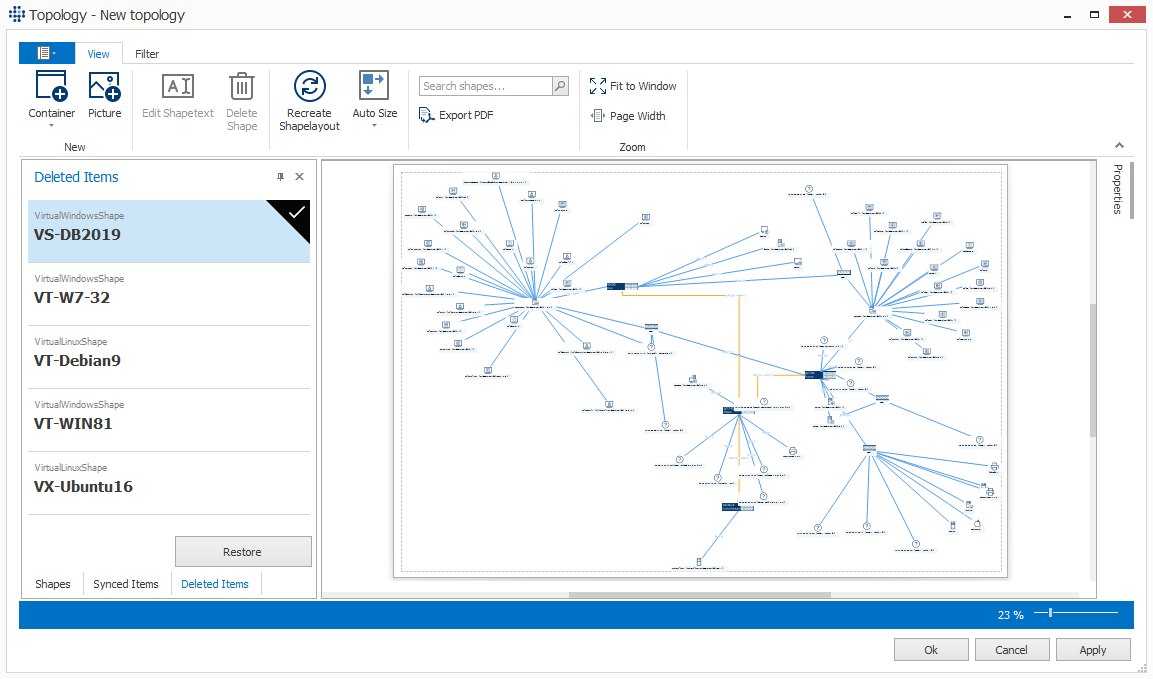
When shapes are deleted from the drawing sheet, they appear in the "Deleted Items" tab. It is also possible to restore from here.