Evaluation
Different user interfaces are available for evaluating the data. By default, the LOGINventory Management Center (LMC) is installed with the installation of LOGINventory and is the tool of choice for most applications. However, if access is required from other computers on which LOGINventory is not installed (e.g. when installing the acquisition components on a server or for colleagues), there are more ways to access the database:
Important
To be able to access LOGINventory from other Windows computers (e.g. clients) without having to establish a remote desktop connection to the server, we always recommend using the portable LOGINventory version. This can be started from a network drive without installation and updates itself automatically when an update is applied on the server.
A setup in which the complete LOGINventory program is installed on more than one device is not recommended or supported by us.
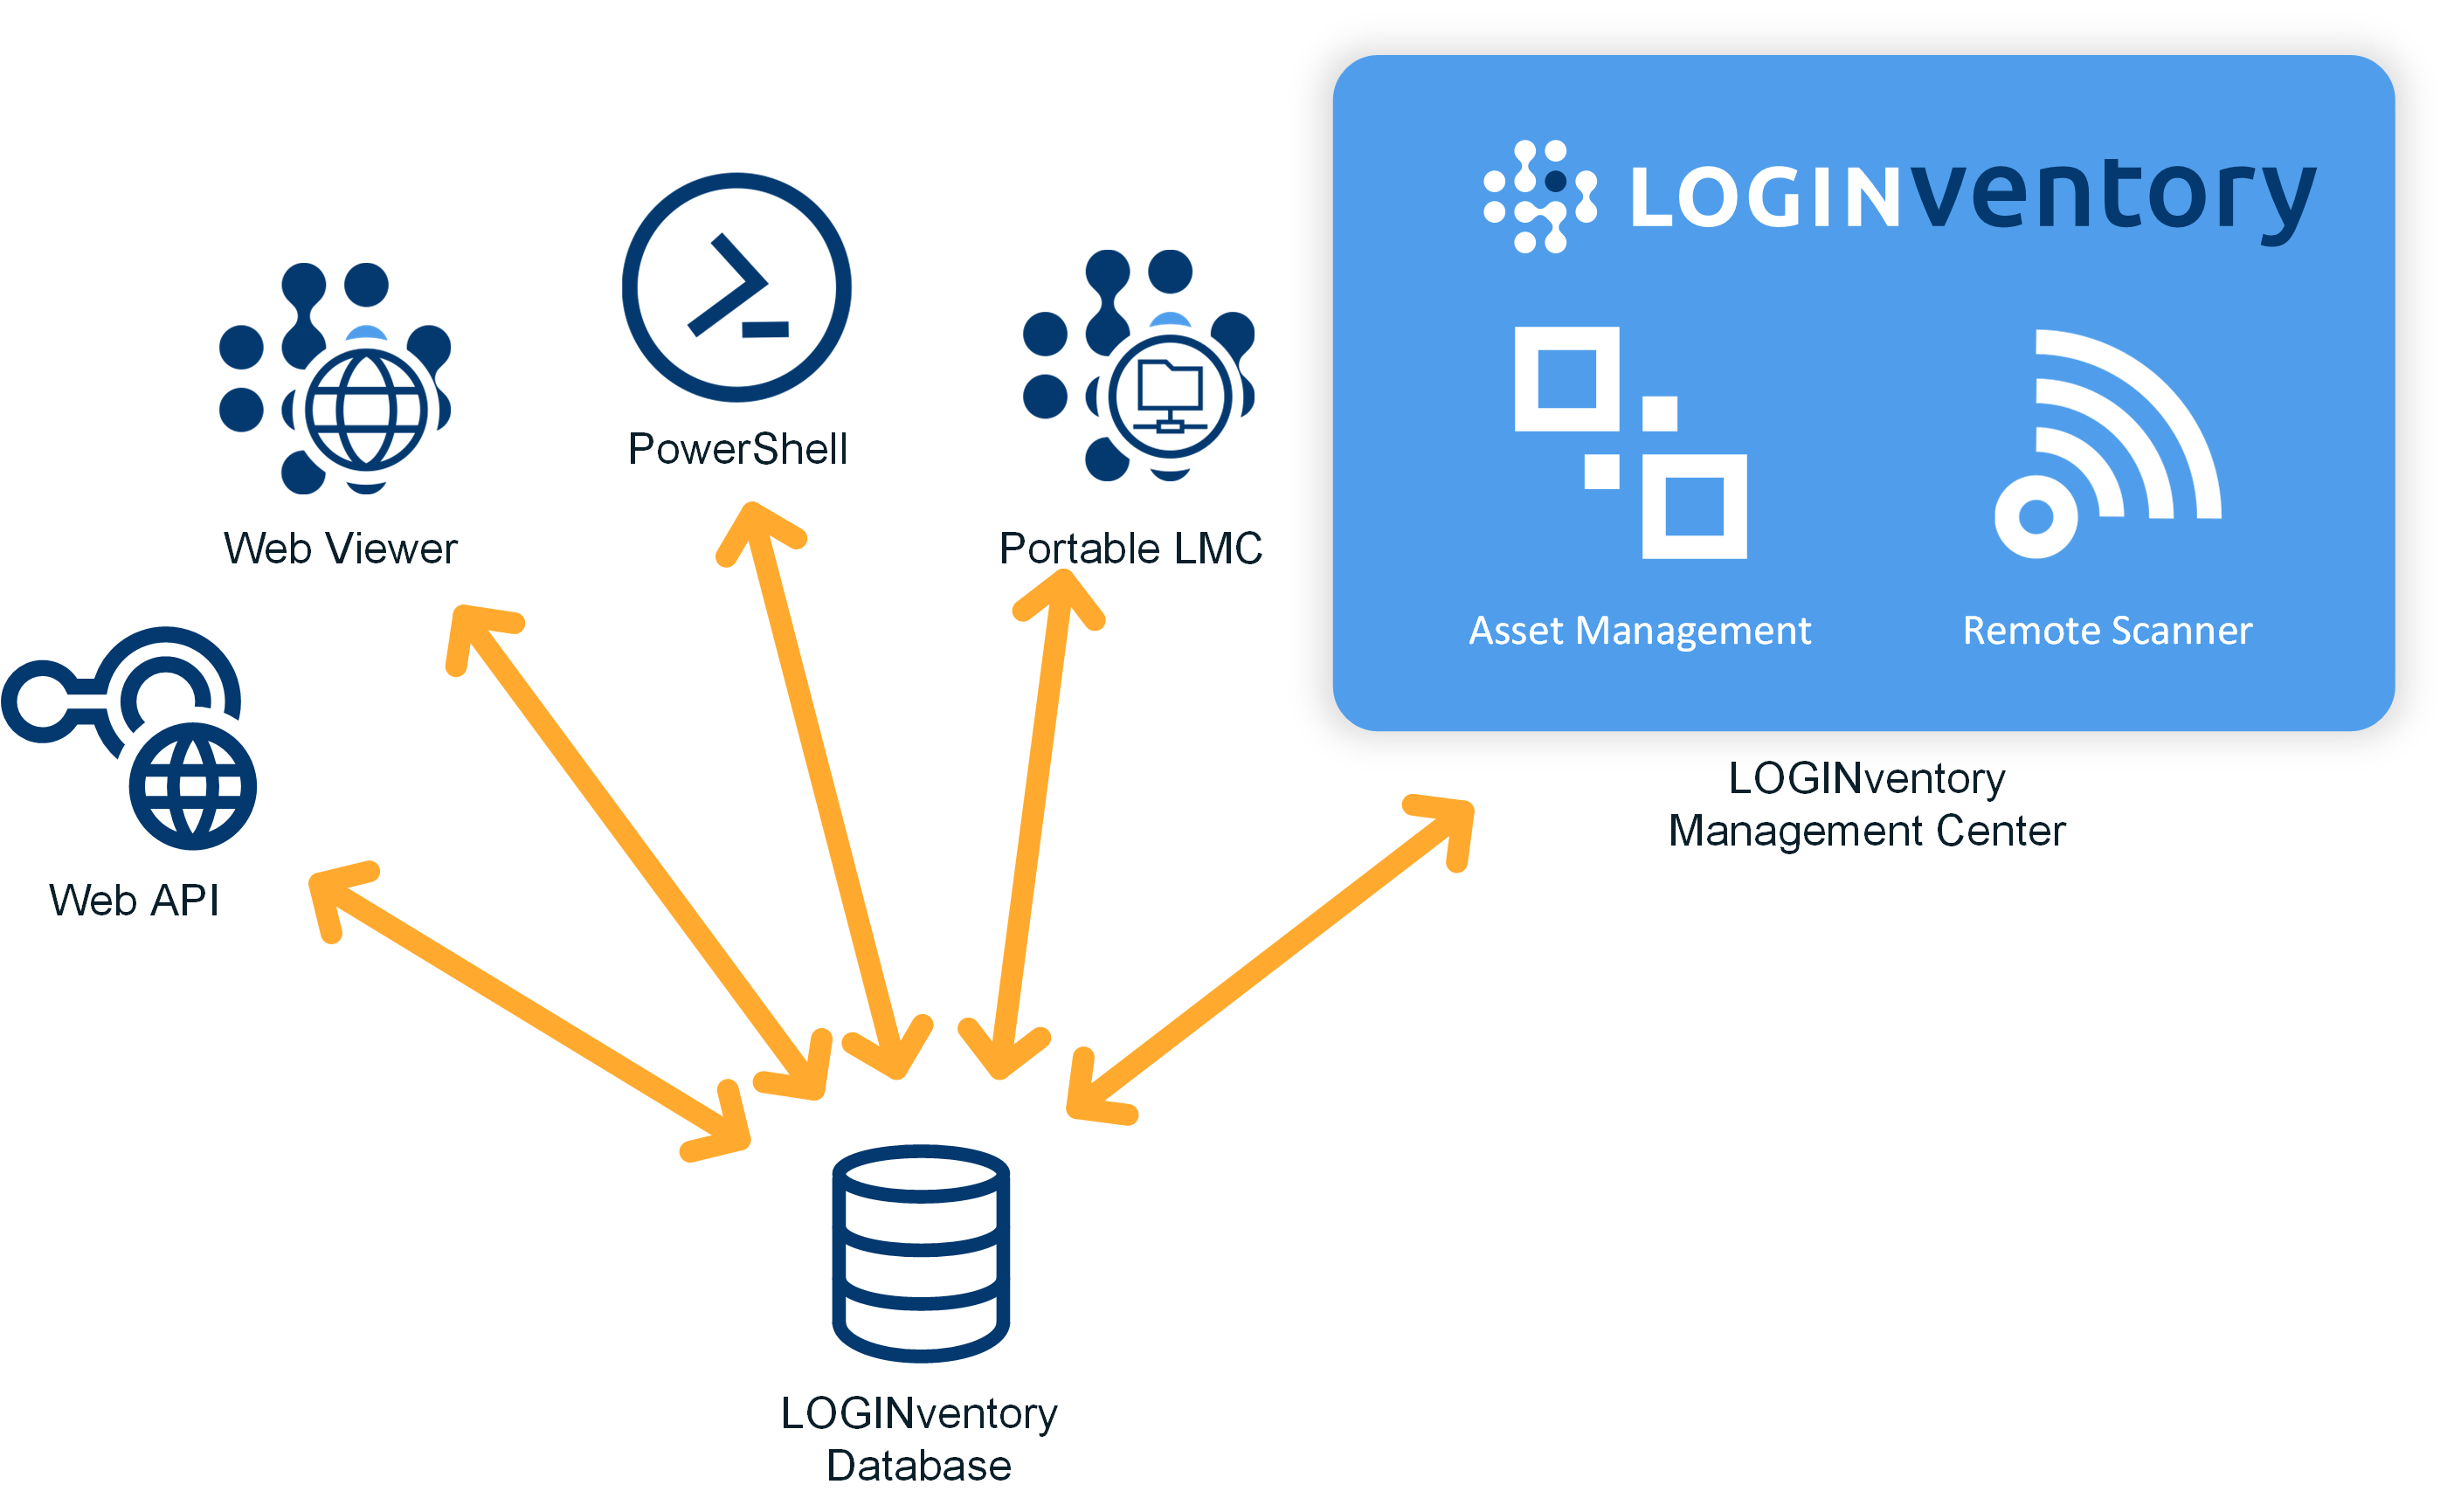
- By publishing the web viewer. This offers several modes:
1. Read access to the entire tree structure and all queries and dashboards.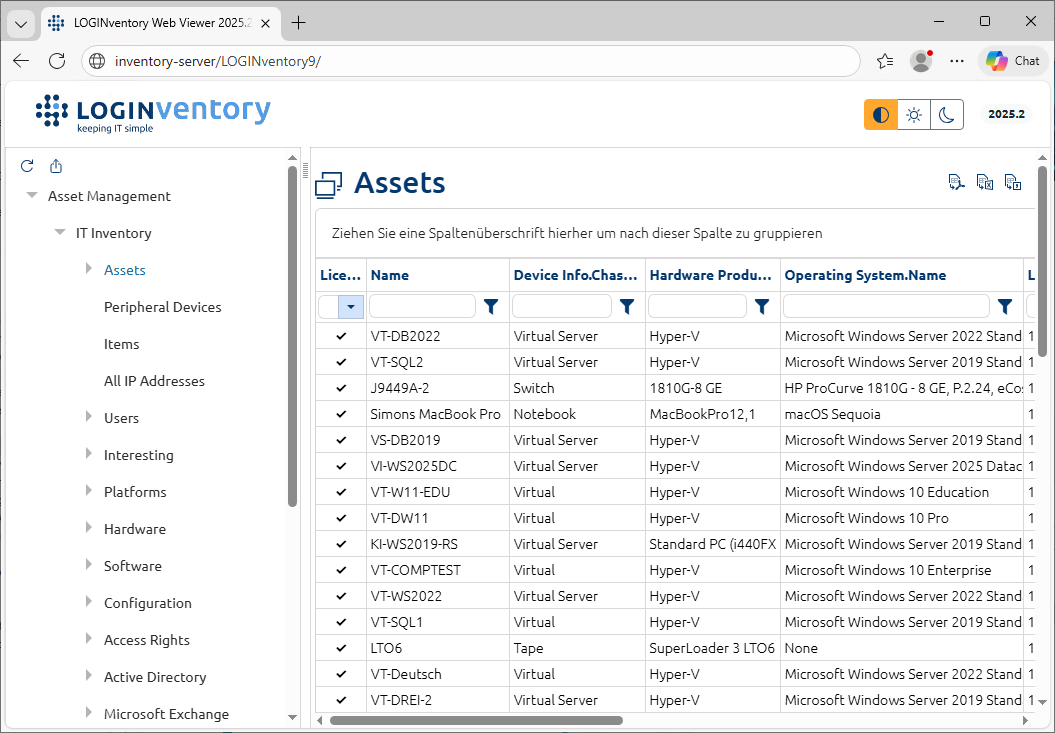 2. Access to an asset or user-specific detail page: Here you can document the handout or return of the device (including signature) or a user can view the assets assigned to them.
3. The ability to create and edit assets, as well as access to our AI Assistant LIA - By accessing the Web API. Thus third party systems can be connected to retrieve data from LOGINventory or write data to LOGINventory via http requests.
- Access via Powershell interface to query or change data script-based.
Info
The user interface and operation of portable LMC and normal LOGINventory Management Center do not differ, but the acquisition can only be controlled by the non-portable version with actual installation.
Info
When calling LOGINventory.exe you can jump directly to a specific asset by using the parameter /q:AssetName, e.g: LOGINventory.exe /q:MyPcName
Basic Operation
Operating Concept
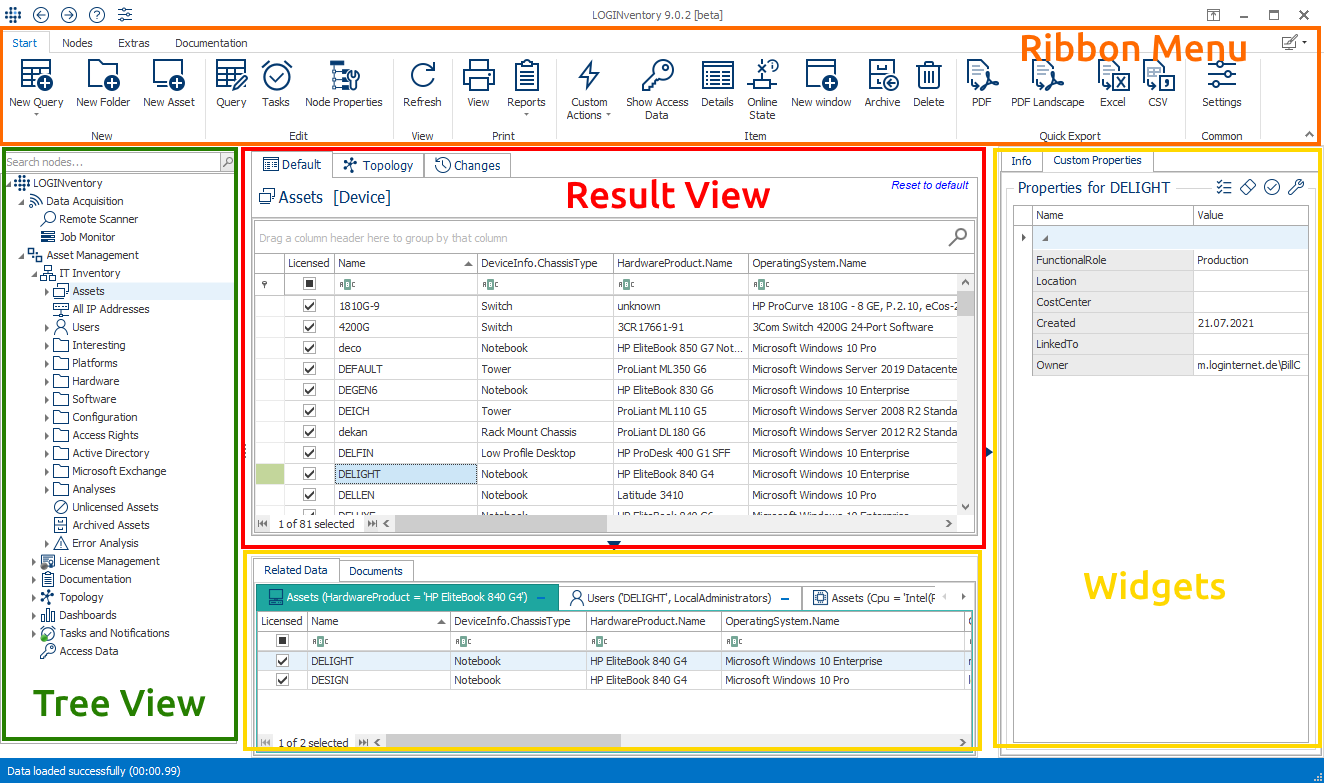
The display and operation of the LOGINventory Management Center are based on the Windows Explorer. The tree view is located in the left area of the display, the result view is located centrally. The LMC uses the ribbon design concept, which dynamically displays menus depending on the current selection and position.
 All successfully acquired devices are listed in
the Assets node. By double-clicking, the details of the respective computer are listed.
All successfully acquired devices are listed in
the Assets node. By double-clicking, the details of the respective computer are listed.
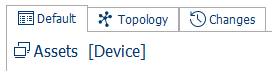
The view in the result view can be toggled with the tabs on the top. These tabs adjust dynamically depending on the selection in the tree view. The following views are available:
- Default: Current data
- Topology: Graphical network representation
- Changes: Historical data
- AD Matching
In addition to the functions displayed in the ribbon menu, context menu functions are always available using the right mouse button. With the widgets on the right side or at the bottom, which can be opened and closed by clicking on the small arrows, details are displayed in the result display according to the selection. If necessary, these can be edited directly there. The following widgets are available:
Right:
Down:
These are described in detail in the respective chapters.
In principle, the following actions can be performed in each view
- Set filter conditions
- Add or delete columns
- Jump to the details by double-clicking on a result row.
- Export the current view (including filter conditions etc.)
- Applying Reports to the Selection
The supplied tree structure can be adapted by the user as required. This is how you can
- create own queries (by selecting desired columns and setting filter conditions)
- create folder structures (for rearranging and grouping queries)
- adapt, copy and delete existing queries
- reset the supplied nodes to their factory defaults.
Attention
The assets are not physically below a specific query or within a folder, as in Windows Explorer. Rather, their values correspond to the filter conditions defined in the query. Therefore the same device can be displayed for example at "Windows Server", as well as at "Virtual Machines". 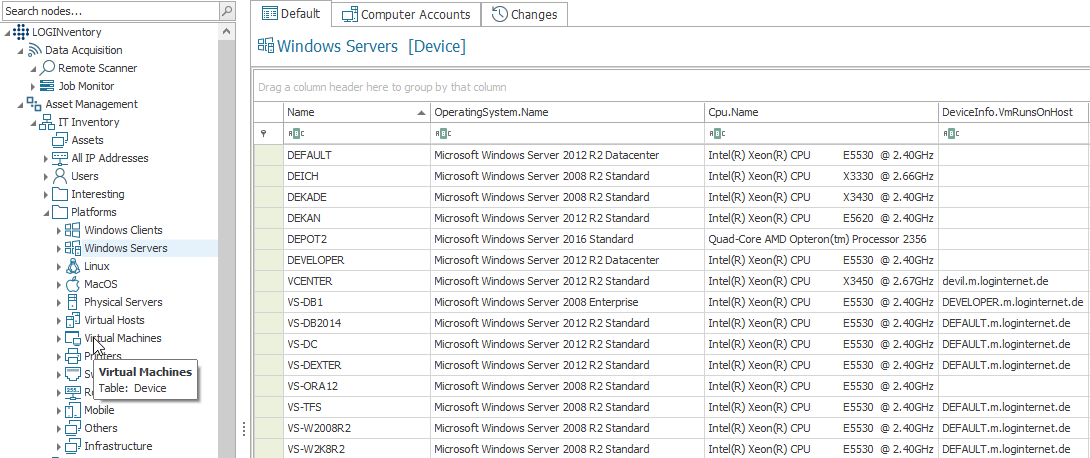
Navigation
In the left tree, navigation is done by simply clicking on a node. If available, subnodes or corresponding data are then displayed in the view on the right.
Info
Please note that a simple click on the arrow next to a node (e.g. Assets) will only display the subordinate nodes if their number is below the limit that is defined in the settings. By default, this is set to the value 200. The icons of the nodes are displayed slightly transparent if they are dynamically generated nodes. In contrast, the icons of folders and queries are displayed normally.
Details of the data displayed on the right can be shown by double-clicking a data record. If, for example, you double-click a PC in the Assets node, all details of this PC will be displayed; if you double-click a single software package in the Software / Software Packages node, all computers on which this package is installed will be displayed. For each node, you can also optionally specify whether dynamically generated nodes are to be displayed. This is possible for each node via the Node Properties. By default, the display of dynamically generated nodes is enabled only for the Asset node.
With the arrows on the top of the LMC you can - like with a web browser - navigate back to the last selection or forward.
Search Nodes
All nodes below the Asset Management node can be searched using the search function.
To do this, simply enter the corresponding search term (e.g. "user") and all node names that contain the term will be displayed. A click on a node from the preview results in a jump directly to this node.
Reset Node
If the node no longer fulfills the required function due to the changes made, it can be reset to the delivery state using the Reset function from the context menu. The node properties are also reset. Subnodes are not affected.
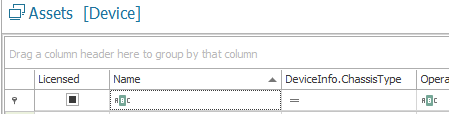
Filtering and Sorting
In the right-hand data area, the information is always displayed in the form of lists. Column headings can be simply clicked to sort the content; another click inverts the sort order.
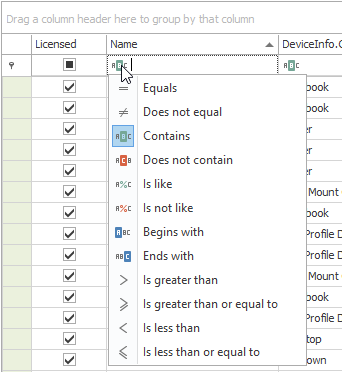
In the filter bar below the column header, you can easily define filter conditions by simply entering a text. This is interpreted as "contains this expression".
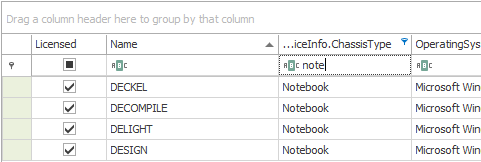
If the entered expression is to be filtered differently, another option can be selected by double-clicking on the symbol next to the filter bar.
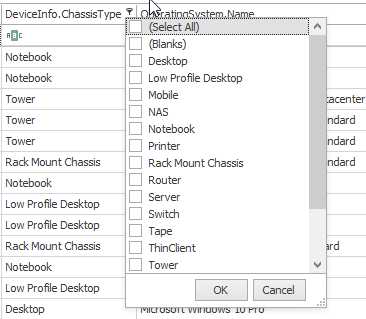
If the mouse is moved to the upper right corner of a column heading, the symbol for extended filter options appears - clicking on it displays a selection list based on the currently available values, which makes further suggestions for filtering.
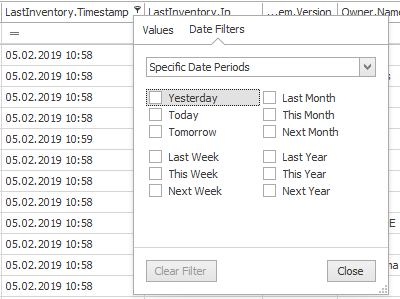
Depending on the selected column, different filter types can also be available, e.g. to filter date values.
Changes to the data layout, e.g. column width and sequence as well as filter conditions, are automatically saved for the respective user. By clicking on Reset to default in the upper right corner of the data area, all individual changes for the current node can be removed. Possibly saved filters are not displayed at the top of the filter bar, but at the bottom of the data area; in addition, [filtered] is displayed in the heading as a hint.
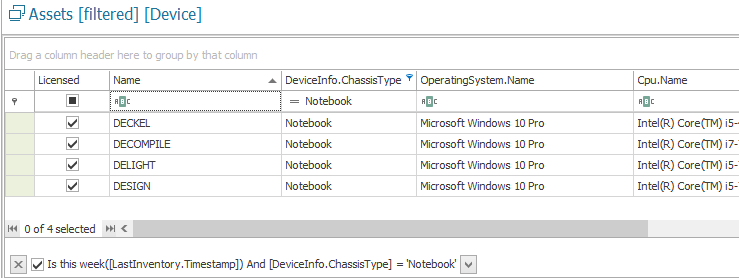
The pull-down menu can also be used to display and select previous filter conditions; to completely delete the current filter condition, click on the [X] at the beginning of the condition.
Group
The upper part of the detail view contains an area that is used to group the data in the detail view.
To activate Group Mode, drag and drop the column header of the property column you want to group by into this area. Of course, you can group according to different properties! By default, the grouped data is displayed expanded in the detail view as soon as the grouping mode is activated. By right-clicking on the column name after grouping, further options are available.
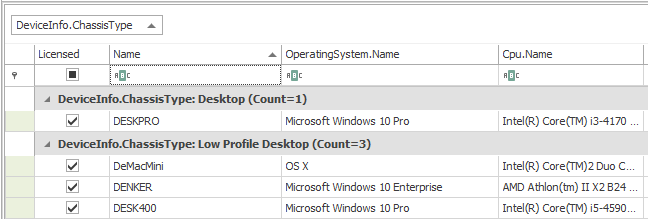
To exit the grouping mode, drag the column name back to the detail view or use the Ungroup function of the context menu.
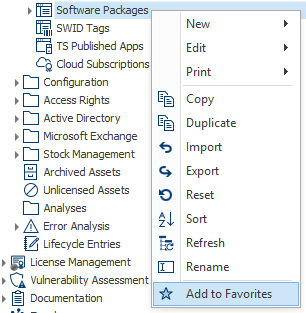
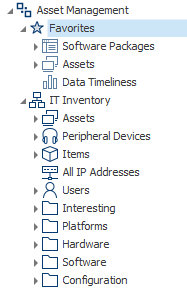
Favorites
By right-clicking on a node in the tree structure, the function Add to Favorites can be selected. The node will then be displayed in the Favorites node at the top of the tree structure. This makes it easy to quickly access important nodes.
Info
Adding nodes to favorites is user-specific, meaning each user can create their own favorites.
Tip
Nodes can also be added as favorites by dragging and dropping them into the Favorites node.
Nodes that are marked as favorites are not stored as copies in the Favorites folder, but are merely linked. Therefore, editing a node is not possible here, but must be done at the original node. All changes will then also be reflected in the view in the Favorites folder.
Via the right-click menu of a node in Favorites, it can also be removed from Favorites again.
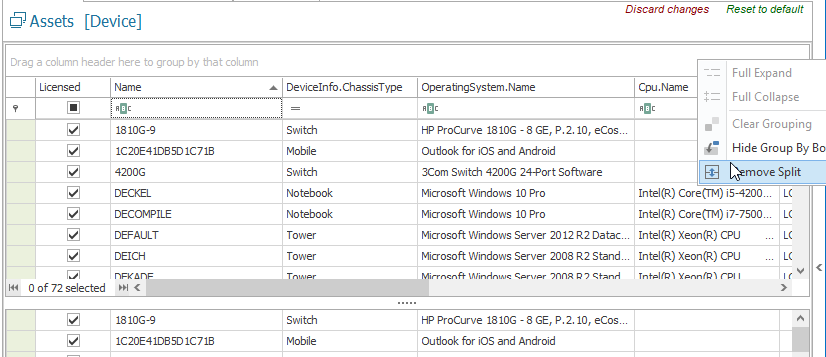
Split Result View
To split the view into two independently scrollable areas, right-click in the area above the column headings to select the Split option.
Widgets
Widgets can be used to display data and values associated with the current selection in the result view. Three of the four widgets can be used to store your own information. The widgets can be opened and closed using the small arrows at the bottom and right.
Custom Properties
In the Custom Properties, own values can be stored, displayed and edited, which are not read out by the default device acquisition.
Important
Custom properties can be used either to manually assign custom values to assets or to automatically set them based on custom rules during acquisition.
Important
In Custom Properties, freely definable custom fields, such as room number, building, purchase date, purchase price etc. can be linked to the assets.
Info
There are special dialogs for the input of warranty information (these can be retrieved automatically online) and inventory numbers (these can be assigned automatically).
Shipped Custom Properties
By default, the following properties are already shipped and can be filled by the user interactively (not using the LOGINfo.script file - see explanation below):
- CostCenter: Free-fillable property for storing a cost center.
- Created: Indicates the date of the first acquisition of the device. Can be changed, for example, if the device was procured before the first acquisition.
- CustomType: Freely definable type of the device. For scannable devices, it is pre-filled with the value from
ChassisType, but can be overwritten. For peripheral devices it is recommended to assign a suitable type in the Asset Editor.Info
If there is an image in the Resource Repository with the same name as the CustomType value, this image will be used in the Info Widget and on the
details.aspxpage (see Handout via Smartphone). - LinkedTo: This property is only available for peripheral devices. When creating a peripheral device from the monitor or docking station information of a device, this property is automatically populated with the name of the linked device. However, it can also be manually adjusted to, for example, link peripheral devices to a different main device.
Important
This property does not update automatically if the peripheral device is connected to another device. It only indicates the device to which the peripheral device was connected at the time it was created.
- Owner: The Owner property is designed to assign a device to a main user / responsible person. By default, the Owner is automatically pre-filled with the user who was the last logged-in user when the device was first scanned, and can be overridden, for example, in the Custom Properties Widget or in the Info Widget. However, automatic initialization can also be disabled in the Settings.
The assigned devices of a user are then also visible in the corresponding reports and queries.Important: Automatically Updating the Owner
The Owner updates itself automatically if the last logged-in user has been the same for five consecutive scans. This behavior can be changed in the Settings.
Tip
If you want to know who the last logged-in user was at a device, use the property DeviceUsage.LastUser.Name. This value is updated with each new acquisition.
Info
Furthermore, the owner of a device is updated by the hand out / return process.
Interaction with Custom Properties
To populate properties, one or more result rows must be selected and then the desired values must be entered in the widget.
Empty properties can be hidden using the respective symbol:
![]()
Info
If several devices are selected (e.g. by using the shift or control key), the properties of several devices can also be edited simultaneously.
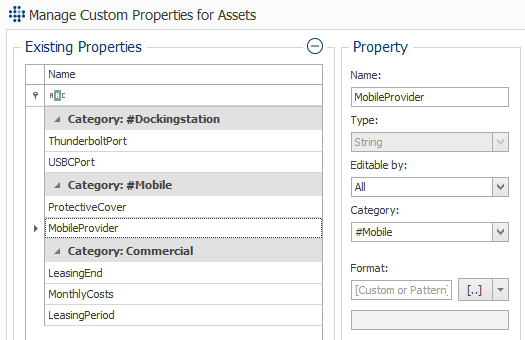
New properties can be created using the widget's settings icon.
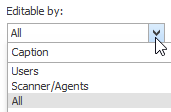
The types DateTime, Decimal, Boolean and String are available for this purpose. The properties can also be divided into categories. You can also set whether the property can be filled by the user and by the scanner (option All) or exclusively by the user or exclusively by the scanner / agent (see Creating your own properties when capturing).
Difference between User- and Scanner-Editable Properties
This differentiation can be made to make sure that a property won't be changed by a scanner which has been explicitly set to a certain value by a user. If you try to set user-editable properties via a scanner, the .inv files will not be entered into the database and will be positioned in the subdirectory "Failed". You can see the error message in the Event Viewer.
Attention
Properties of type "Scanner" or "All" are cleared during an inventory scan if at least one other custom property is set during the scan. This behavior can be globally disabled by adding the following entry to the LOGINventory.config file (%programData%\LOGIN\LOGINventory\9.0\LOGINventory.config):
<setting name="ClearMissingCustomProperties">
    <value>false</value>
</setting>
Therefore, we recommend setting properties that should only be filled by the user in the interface to the type "User".
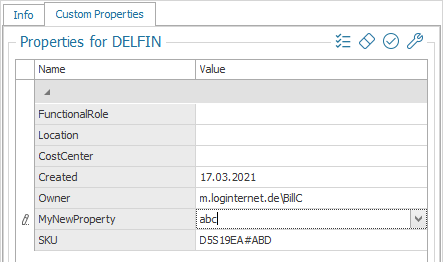
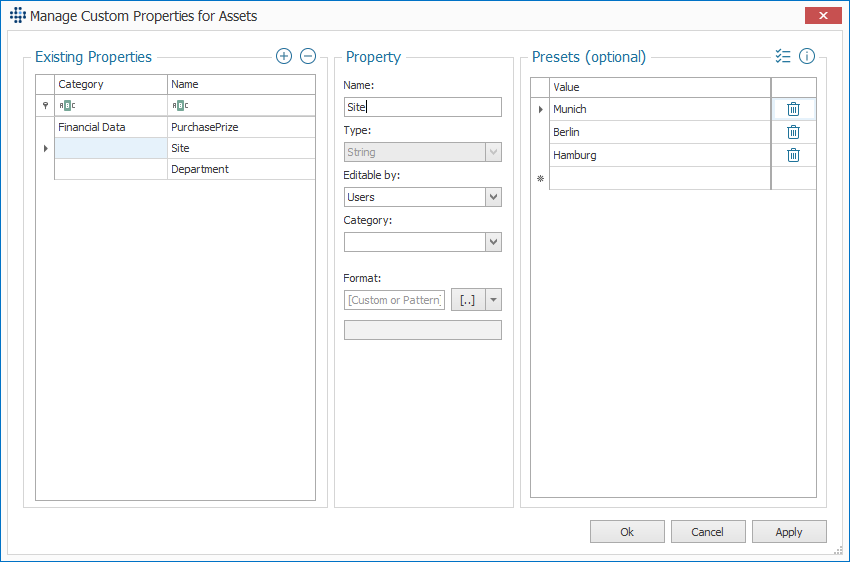
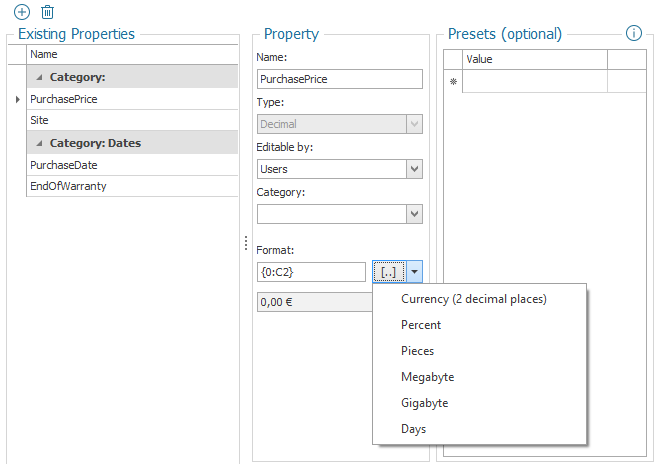
Optionally, a preset list with valid values can be defined for each property. Depending on the type of the property, you can also define a format.
Presets
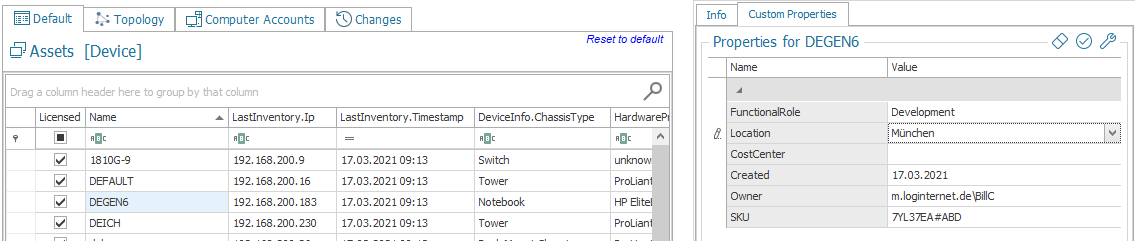
If presets are defined for a custom property, only the fields defined in the preset list can be selected in the widget when filling the properties. For example, the three values "Munich", "Berlin", "Hamburg" can be set as defaults for a custom property "Site" and it is not possible to define other values.
Attention: The presets do not apply when filling properties using the PowerShell, but only when filling properties in the user interface.
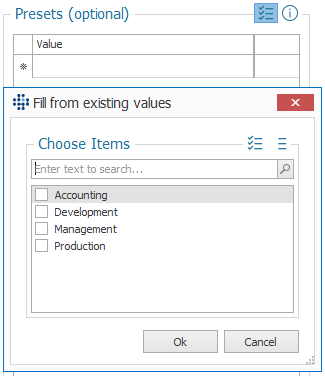
If there are already values for a field in the database, then these can be used to fill the presets based on the data by clicking on the corresponding icon.
If a new property has been created here, the property field is available for all entries in the table and can be filled. If a property is deleted, the stored values are also deleted for each entry!
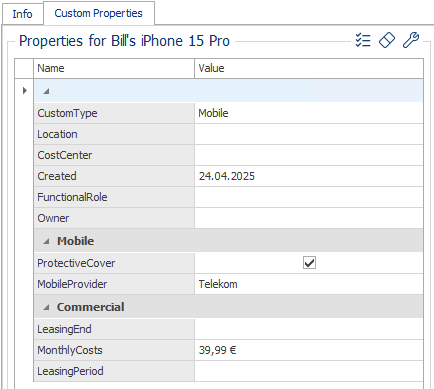
Custom properties can be assigned to a category. This category is then visible in the widget:
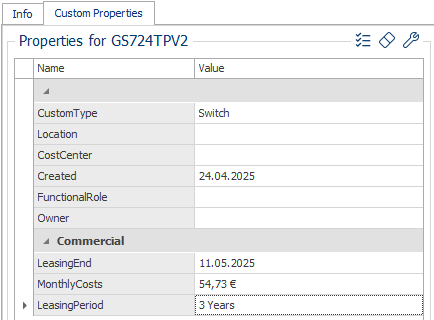
When naming the category, there is a very useful feature: If the name begins with a # symbol followed by a CustomType (see above), this category will only be displayed for assets of that specific CustomType. For example, the category #Mobile ensures that this category is only displayed for mobile devices. For mobile devices, other categories that begin with a # symbol will not be visible. Categories without a # symbol are visible for all assets.
Info
All values stored here can of course also be used in your own queries! This makes it possible, for example, to evaluate the devices for which the leasing will expire within the next 30 days (filling the "LeasingEnd" property), to split the assets according to room number, etc..
Important
In many other places, custom properties can also be useful. For example, hotfixes can be classified into "important" and "unimportant", software packages can be divided into categories (e.g. "freeware", "driver", "fee required") or tagged as "unwanted", and much more.
Automatically Setting Custom Properties
During the acquisition of devices, custom properties can also be set automatically. For this purpose, a rule must be defined, for example, in the LOGINfo.script file that sets the custom property.
Info
If only the Remote Scanner is used during acquisition, meaning neither the Offline Agent nor the LOGINfo.exe is utilized, then simple assignments can also be made directly in the Remote Scanner itself. If other acquisition methods are used in addition to the Remote Scanner or if more complex assignments are required, then adjustments must be made in the LOGINfo.script file.
Example
If all devices found in a specific IP range are to be assigned a custom property "Site" with the value "Munich," an entry can be set in the Remote Scanner under the definition of type Asset Inventory (which scans the desired IP range) in the "Asset Properties" tab as follows: 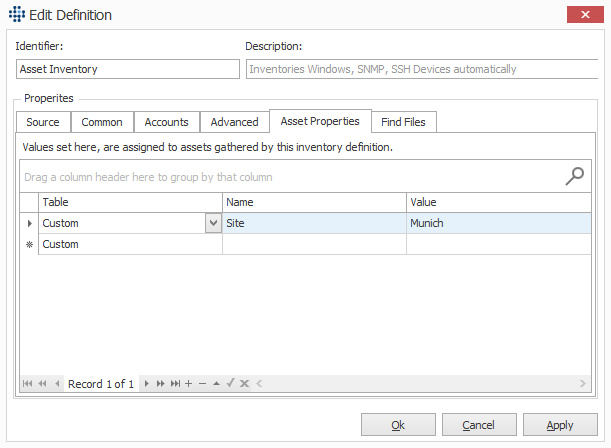
If the same is to be done in the LOGINfo.script file, the entry could look like this:
!IF {like:%$Lastinventory.Ip%,192.168.10.*}
Custom.Site=Munich
!ENDIF
In both cases, after a successful acquisition, the custom property "Site" will be visible for the devices, among other places, in the "Custom Properties" widget. The custom property "Site" does not need to be created in the widget beforehand; it will be automatically created as soon as it is set for the first time. Subsequent categorization is, of course, also possible (see Interaction with Custom Properties).
Example
If you want to determine the amount of free physical memory (in KB) for Windows devices during acquisition, this can only be achieved by modifying the LOGINfo.script file. The entry could look like this:
Custom.FreeRAM={wmi:Win32_Operatingsystem,FreePhysicalMemory}
For devices where this WMI value cannot be queried (e.g., printers), the custom property will simply remain empty. An if-condition to restrict this to Windows devices is not necessary.
These examples demonstrate that assigning custom properties in the Remote Scanner is only suitable for simple assignments: All devices captured in the specified IP range receive the same value. More complex assignments with multiple conditions or dependencies on other values are only possible in the LOGINfo.script file.
Documents
In LOGINventory any files, folders and links can be connected to folders and queries in the tree structure and to items in the data view. This feature is suitable, for example, to store invoices and purchase documents directly on clients, to manage exports of the server configuration to the corresponding node or to conveniently link the software license documents in license management.
Important
When storing files, you can select whether the files should only be linked, or whether the files should be stored directly in the LOGINventory database.
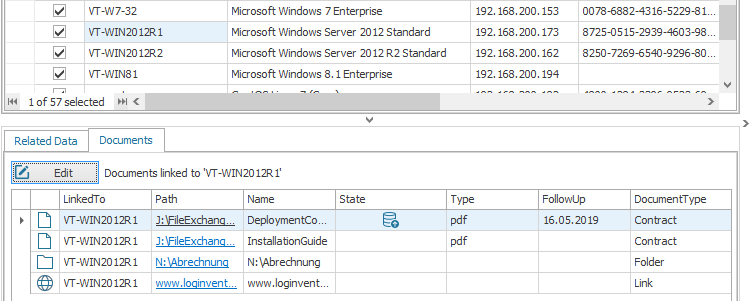
Using the Documents widget, you can add any number of files, folders and links to the currently selected item (in the tree structure or in the results list).
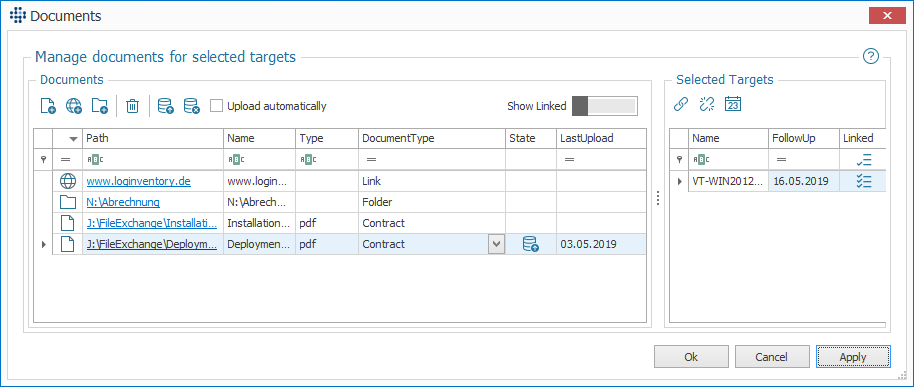
If you are storing files, they can be saved in the database. This means that the stored document can still be retrieved, even if it is removed from the original storage location. You can also set the checkbox so that future added files are automatically saved in the database. Of course, this does not apply to folders or links.
A double click or STRG + click on the pathname opens the corresponding document directly. A freely definable document type (e.g. "contract", "invoice", etc.) as well as a follow-up date can be stored for each document.
Info
The icon in the "Status" column of the documents indicates whether a file has been linked or saved in the database.
Important
Several result rows can be selected in both the list of Documents and the list of Selected Targets. You can then see, for example, whether all objects are linked to all selected documents. This is indicated by the corresponding icons in the "Linked" column next to the objects. 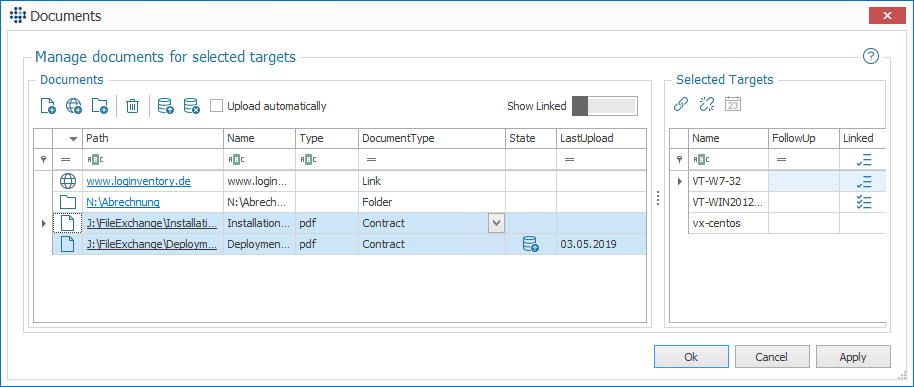
Also the follow-up date can be changed for several objects at the same time.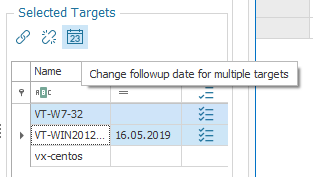
Example
If an invoice is to be linked to serveral devices simultaneously, the corresponding devices can be selected in the asset list with the shift and control keys. If you then click on "Edit" in the document widget, all deposited objects will be linked with all previously marked assets.
Info
An overview of all stored documents can be found in the node Linked Documents below Documentation in the tree structure. Here you can also filter for example according to the follow-up date. 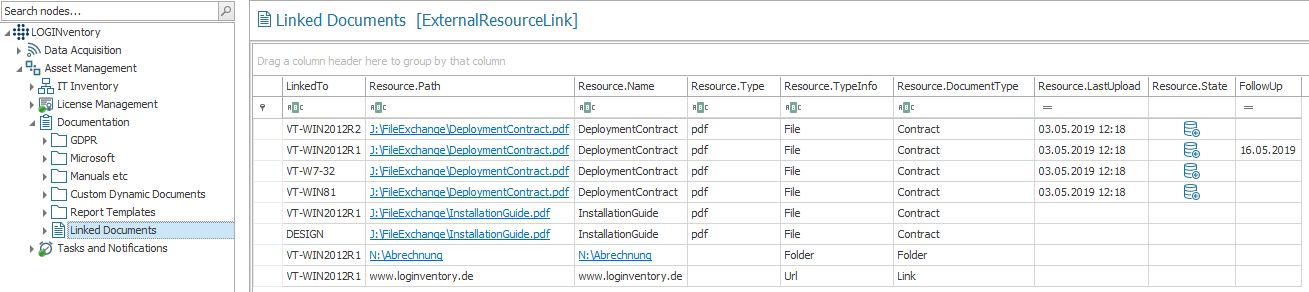
The Documents tab is also available in License Management. If possible, the corresponding proofs of purchase of licenses should be stored here directly. This makes it possible to trace the source of the figures entered for the purchased licenses and, in the event of an audit, you have these proofs quickly and easily at hand.
Tip
It is generally recommended to work with UNC paths when linking so that the call can also be made from other computers. Alternatively, the documents can also be saved directly in the database.
Info Widget
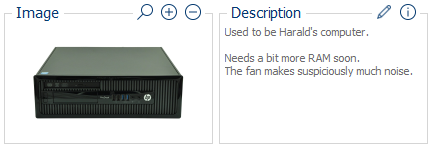
The Info Widget displays some relevant information about the selected asset, a picture of the device, shows ping status and warranty data, and offers the possibility to add own multiline description and lifecycle entries.
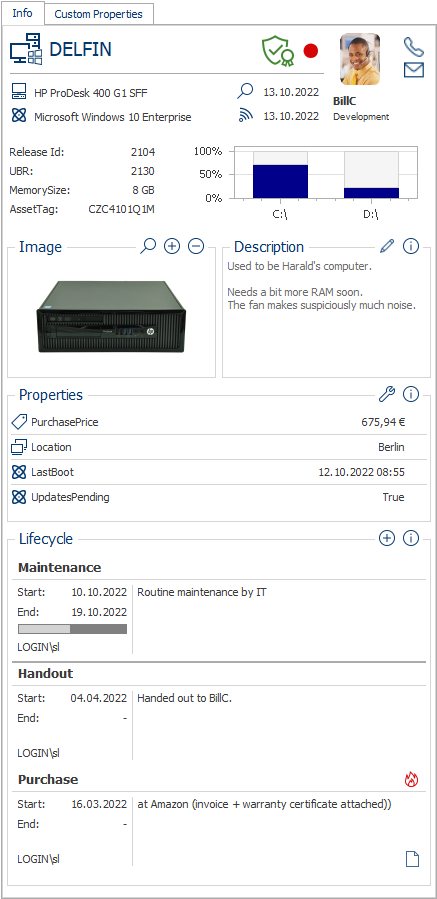
The info widget is divided into different areas. The topmost area displays selected information about the model, operating system, and date of last acquisition. It also displays profile photo (from AD) and contact information about the owner of the asset. The owner can be customized in the Custom Properties Widget.
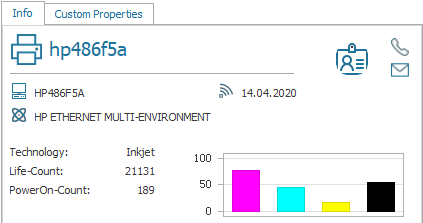
Depending on the asset type, different properties are preselected and relevant information is also graphically displayed, such as the ink level in printers.
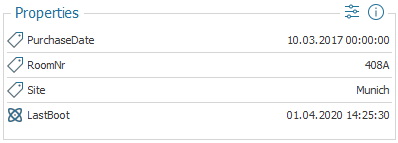
In the Properties area, each user can freely define which additional properties should be displayed in the widget. To do so, all available properties can be searched and selected by clicking on the settings icon.
Tip
Here it can be useful to display especially custom properties (search for "Custom"). Or display further information on the owner, such as his department. Use this room to display the information that is important to you!
In the next area, you can store an Image and a freely definable multiline Description. To customize the text, click on the edit icon. By the way, the description stored here is stored in the value Device.Info and can be displayed - like any other value - in own queries.
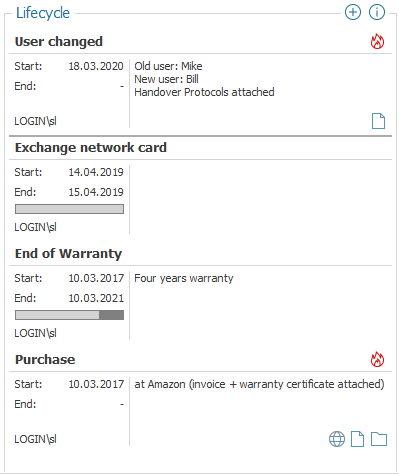
In the Lifecycle area, a journal can be kept in which events, notes, dates, ... for the respective asset are noted. This way - together with the change history - the complete lifecycle of a device can be documented.
Tip
When you are using the mobile web site to document the handout or return of a device, a corresponding lifecycle entry is being created automatically.
If documents have been linked to the lifecycle entry, there are icons corresponding to the selected document type (file, URL, folder). You can open the respective document by clicking on the symbol.
Info
If the current date is between the start and end date, the progress within the specified time period is shown by a corresponding bar.
By clicking on the plus sign, new entries can be written. When you hover the mouse over an existing entry, the edit icon will become visible, allowing you to edit entries already created.
The behavior when depositing documents corresponds to the Documents Widget. However, the documents stored here are linked directly to the lifecycle entries and can therefore be used to store repair documents, transfer logs or similar.
Tip
More information on lifecycle entries can be found below.
Related Data
The Related Data widget displays information associated with the selection of the results row, e.g. devices with the same hardware, devices with the same operating system, devices on which the same user was last logged in, etc.
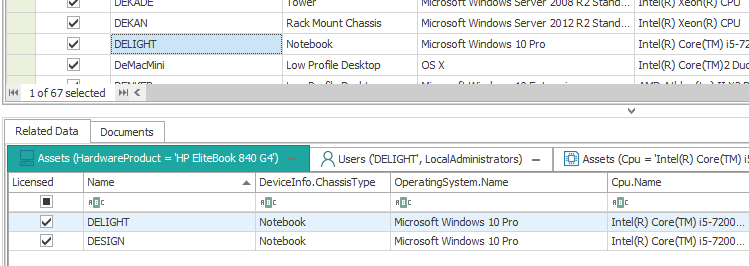
Depending on the table selected, other information may also be displayed, for example, for software packages, you see all devices that have this package installed. For AD groups, you see their members. In principle, this widget is used for quick evaluation and helps with a simple overview.
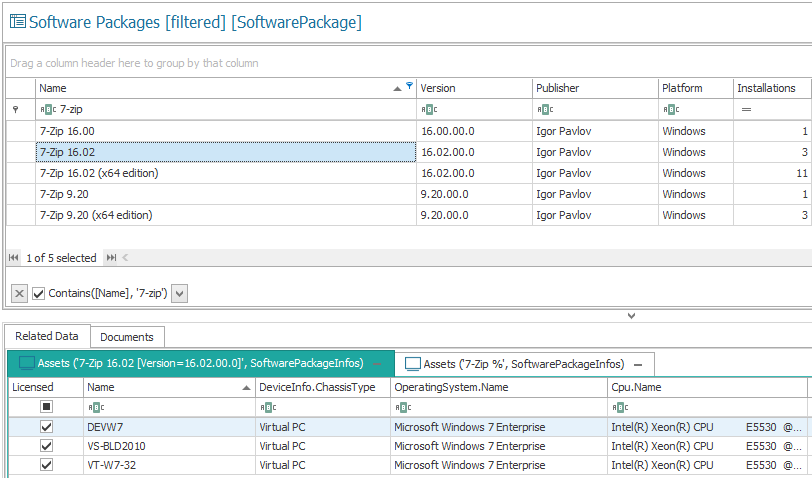
Info
In the case of software packages, there is also an additional tab available in the widget that does not filter by version. This tab shows e.g. all devices with a certain software - no matter in which version.
In addition, by clicking on the -- sign next to the respective column name in the widget, the selection can be inverted (displayed in red), whereby devices are displayed which, for example, have not installed the selected hotfix, have a different operating system, etc.
Data Analysis and Evaluation
LOGINventory already comes with a large number of evaluations (or queries) that make it possible both to obtain an overview of the entire network and to carry out detailed analyses for individual devices or installations. All provided queries can be adapted (selection of columns to be displayed, setting of filter conditions) to enable individual data analyses (see Own queries).
Important
Each successfully inventoried device is created as an asset and is visible in the Assets query. Assets can also be created manually or from incorrectly inventoried assets and imported from .csv files.
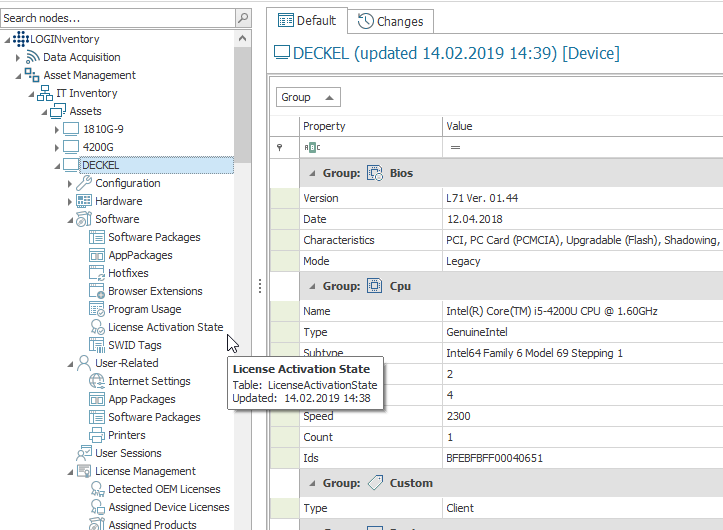
A double-click on a device creates a dynamic node below the Assets node for easy navigation between different devices. In addition, the details (all 1:1 relationships (device type, operating system, acquisition method,...) to the device) are visible in the results view. By clicking on the arrow symbol next to the dynamically generated node, the 1:n relationships (memory modules, hard disks, software packages, shares,...) to the device can be selected. The data displayed depends on the type of device.
Under All IP Addresses, all IP addresses are listed and it is possible to see which devices could be inventoried or which errors occurred with unrecorded devices.
Info
All user accounts are listed under users. If a user is selected, the assigned devices, devices on which the user has admin rights and authorizations on file system and database level are visible.
If evaluations are to be carried out for more than one device, the supplied queries in the tree structure can be used.
Explanation of the Tree Structure
The queries always refer to all successfully recorded, non-archived devices or manually created peripheral devices. The following folders can be found in the tree structure:
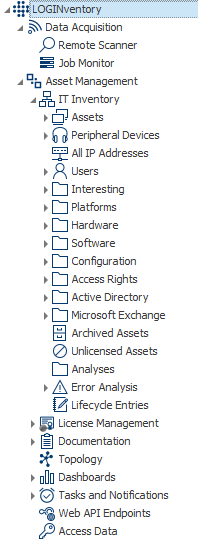
- Interesting: This folder contains queries with filter conditions that provide an up-to-date overview of interesting aspects of the network, e.g. newly found devices, device that were not updated for a longer period, devices without up-to-date antivirus definitions, occuipied partitions etc.
- Platforms: Queries structured by type of device or operating system (e.g. Windows Server, Virtual Hosts, Printers, Laptops). Caution: the devices displayed in the queries were not sorted manually and cannot be re-sorted, but correspond to the filter conditions defined in the query.
- Hardware: On the first level there are summaries about the hardware of all successfully registered devices (e.g. which CPU/ drive, USB device, ... is how often in use). In the Related Data widget, the respective devices with the selected hardware are visible. There are no summaries in the Query Lists folder, but detailed views in the form "Device Name + Existing Hardware". For example, the query list Monitors for each computer shows all recorded details for all connected monitors (including serial number, production week, etc.).
- Software: On the first level there are summaries about the software of all successfully recorded devices (e.g. which operating system/hotfix, software package, ... is how often in use). In the linked data widget, the respective devices with the selected software are visible. There are no summaries in the Query Lists folder, but detailed views in the form "Device Name + Existing Software". For example, the query list Product key for each computer shows all details entered for all activated software packages (including product key, installation date, installation location, etc.).
- Configuration: On the first level, there are breakdowns of the server roles available in the network.The Query Lists folder does not contain summaries, but detailed views in the form "Device Name + Configuration". For example, the Listening ports query list for each host shows all the details captured for all open ports.
- Access Rights: Among other things, the access rights to shares, shared folders and databases are displayed here. In addition, the effective permissions to Shared Folders are displayed. Attention: For performance reasons, this query is not recalculated for each selection, but only if "Recalculate on Server" is selected in the ribbon menu or automatically with the respective system task.
- Active Directory: All groups, accounts and computers imported from the AD and their properties are displayed here. In the widget Related Data, the members of the respective group or the memberships of the respective user are visible.
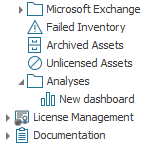
- Microsoft Exchange: Displays details of all Exchange servers, Exchange databases, and Exchange mailboxes.
- Analyses: This folder is good for creating own queries.
- Error Analysis: Here you will find information about failed or incomplete scans, as well as explanations for the reasons and help on what can be done to correct the error.
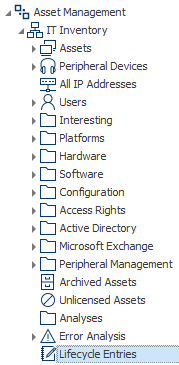
In addition, the first level of the IT Inventory folder contains the queries Archived Assets, Unlicensed Assets & Lifecycle Entries (see Info Widget).
Info
In the Unlicensed Assets list, all devices appear that have been captured by LOGINventory, but for which you do not have sufficient LOGINventory licenses to view the details of that device.
Example: If you have a license for 250 assets and scan 251 assets, then the most recently scanned device will show up in the Unlicensed Assets query and you will only see the name of the device, but no details about the operating system, software, hardware, etc..
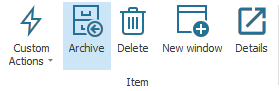
Archiving and Deleting Assets
Assets can be archived and deleted via the ribbon menu and the context menu. Archiving results in the asset being moved to the archive and thus excluded from all queries. However, the change history and the assigned properties are retained. With a valid LOGINventory license, as many active as archived assets can always be kept in the database.
If an asset is deleted, its change history and all stored properties, journal entries and documents are also lost.
In both cases, however, the following applies: If a deleted or archived asset is newly recorded, it automatically becomes an active asset again. To prevent certain assets from being created, a definition of type exclusion from inventory can be created or the capture can be modified accordingly.
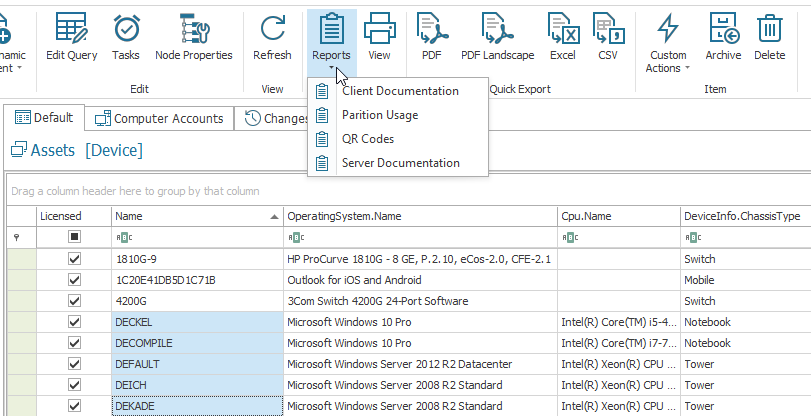
Data Export and Creation of Documentation and Reports
The current data view can always be exported to different formats (pdf, xlsx, csv, html) including all set filter conditions, groupings and adjustments of the column order via the ribbon menu Quick export. Via the ribbon menu Print / Advanced further settings for format, page layout, etc. can be made. Further export formats and the option to send directly by email are also available.
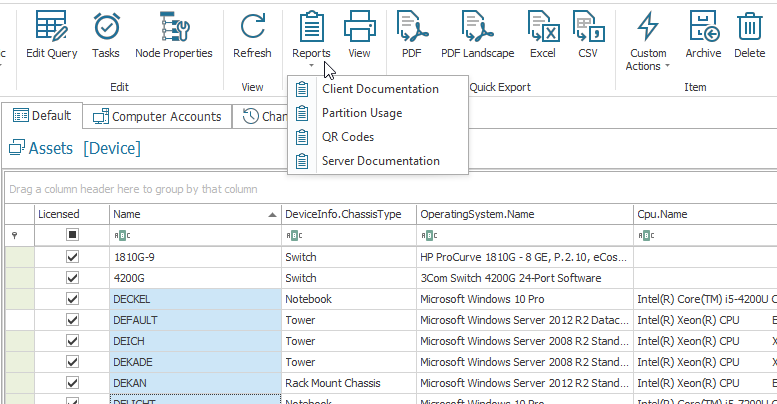
In addition, the supplied report templates can be applied to the current selection via the ribbon menu Print / Reports. This means that if a query was last selected in the tree, the corresponding report is applied to all query results. If the report is only to be applied to a selection of elements, these must first be selected in the result view using the Shift and Control keys. The report templates are still customizable and of course new report templates can be created.
In addition, dynamic documents can be created at any position in the tree using the ribbon menu.
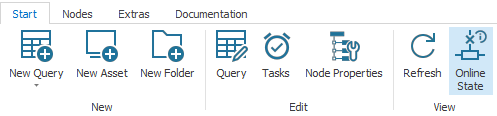
Ping Status
Via the ribbon menu the Online Stauts (Ping Status) of assets or IP addresses can be queried and displayed - depending on the selection in the ribbon menu Start under View or Element.
To do this, a query must be selected whose entity is one of the following: Device, InventoryInfo, DeviceInfo, MacAddressTable, NetworkAdapterInfo. HpManagementProcessorInfo, or SwitchConnectionInfo. In addition, an IP address must be known for the corresponding entry. Then either for all result lines or for a selection (STRG- key or Shift key) the online status can be queried by pinging the IP address.
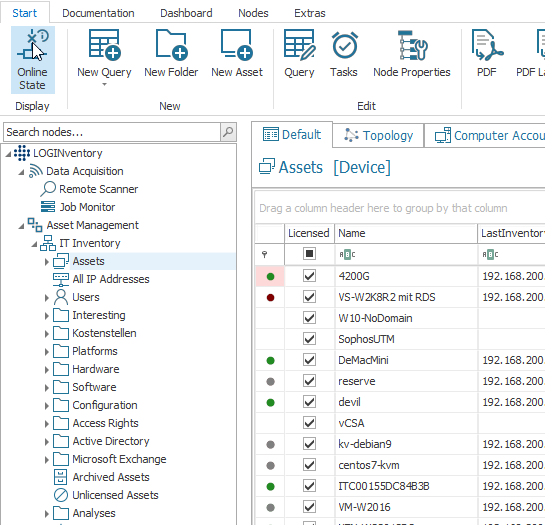
The result of the ping can then be seen in the first column:
 green dot: Ping response received
 red dot: no ping response received
 grey dot: waiting for ping answer
 no dot: was not pinged (e.g. because no IP address known)
In addition, the current ping status is displayed in the info-widget as soon as an asset is selected. If needed, this automatic ping can also be disabled in the settings.
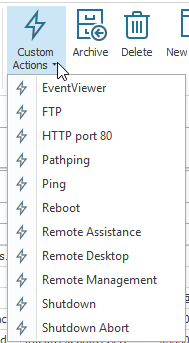
Custom Actions
From every query node in LOGINventory it is possible to start external programs and supply them with parameters from the database - if these actions have been defined here before. Depending on the table selected in the Custom Actions, the possible actions appear in the ribbon under Element / Custom Actions as soon as the corresponding entry is selected in the result view. If, for example, an asset is selected, the following actions are available:
In Customizing, you can check the existing actions and create new ones by defining which command is to be available for which table with which transfer parameters.
Queries
All information in LOGINventory is based on queries arranged in a tree structure. Users can of course also create own query nodes or modify the provided queries.
- In principle the (context menu) function New Query can be used to create new queries at any position in the LOGINventory tree. To do so, choose New Query from the ribbon menu.
- For a better overview of the queries it is recommended that you use the New Folder function to add subnodes. They help to classify the queries.
- Each existing query can be edited, copied, deleted and reset to the default settings to display the values that are really of interest.
- If a new node is created as a subnode of an existing query, the upper query serves as a pre-filter for the new query!
Important
By arranging queries one below the other, multi-level evaluations are thus possible.
Example: Filtering at first level on a site. Positioning of a query on software packages below.
Result: Only the software packages of the respective location are displayed. Such structures can also be used multiple times to perform the same evaluations for different locations. 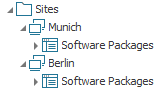
Info
In general, own queries are used to make frequently required evaluations directly available without having to set filter conditions in the existing queries. Typically, custom queries contain e.g. sorting by location or IP subnet, time filters on warranty or purchase date or evaluations on which notifications should be set.
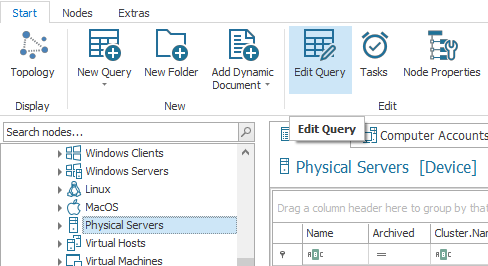
For example, to display additional columns in the Assets list (such as stored custom properties) you can select "Edit Query" from the ribbon menu on the Assets node and search and select desired properties. After closing the Edit window, the additional columns are then available in the Assets list.
Tip
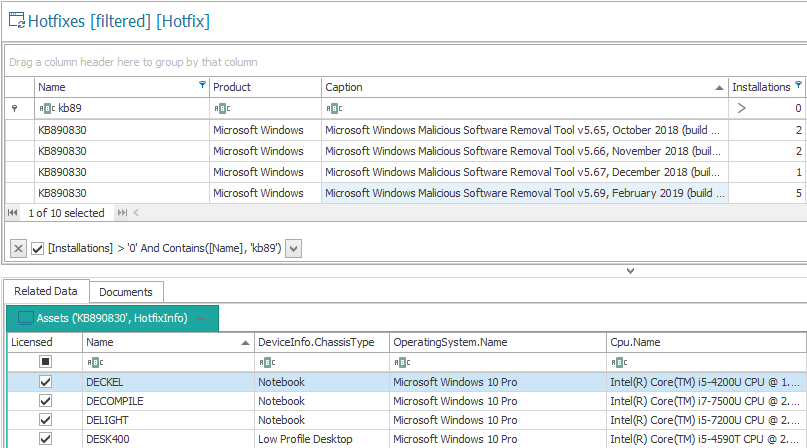
To create an additional query with a filter condition (e.g. filtering on hotfix names) underneath an existing query (e.g. hotfixes), the function Create filtered Query can also be selected from the context menu. Afterwards, the column to be filtered can be selected. In this example, the progress of the hotfix rollout can be checked quickly and easily with just one click. 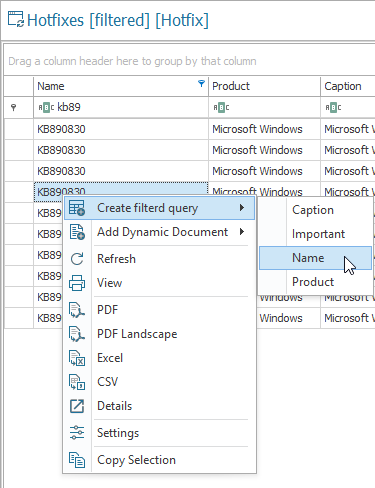
Query Editor
The query editor is roughly divided into five main areas:
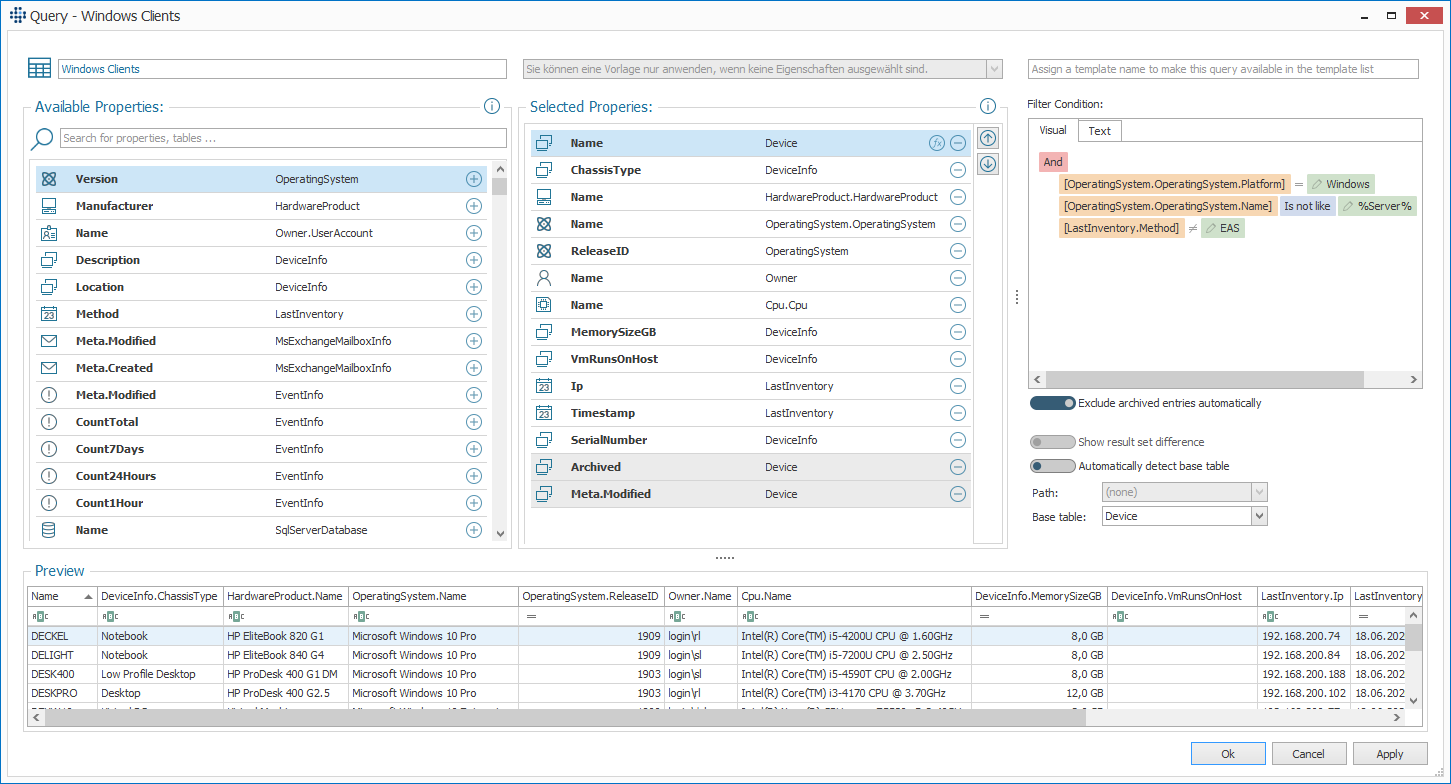
- In the left area, the list of available properties can be searched and these can be transferred to the two areas next to it (
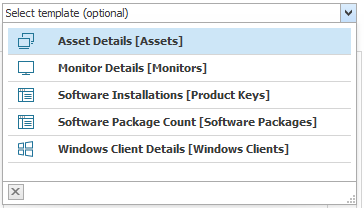
+sign, double-click or drag & drop). - In the middle area, the previously selected properties are listed. If no property has been selected yet, a template can also be selected. The column order can also be defined here (drag & drop or arrow buttons).
- In the right area, filter conditions can be added, edited or removed.
- In the lower area, a preview of the future query is visible.
- Instead of manually selecting properties and filter conditions, you can also generate a query using the AI Assistant LIA. For this, you can describe in natural language what you want to display in the right area.
In addition
- in the upper left corner the name of the query can be changed,
- in the upper right corner the current column selection can be saved under a template name,
- a Function can be applied or the display name of the selected properties can be edited,
- additional adjustments can be made below the filter area .
Available Properties
There are more than 1000 different properties available that can be used in queries. You can distinguish between two search modes: Smart Search and Classic Search.
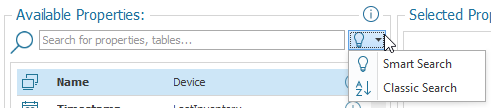
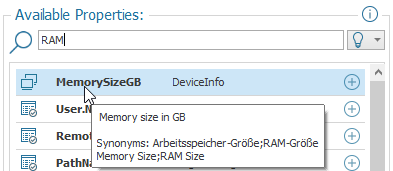
Only one search field is available in the Smart Search. In this full-text search, several terms can be entered one after the other to further limit the hits. The most frequently used properties will appear at the top of the search results. The search algorithm takes into account how often the properties are used in your tree structure. For example, if you use a Custom Property "Room Number" in many queries, it will also appear at the top of the search results.
If no keyword is entered in the Smart Search, the most frequently used properties will appear at the top of the search results. You can search for terms in both English and German.
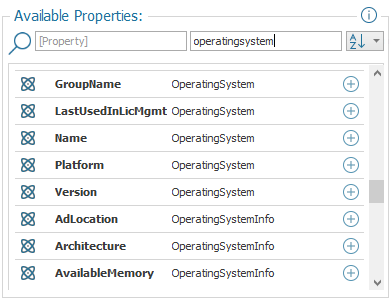
Two search fields are available in the Classic Search: Property and Table. This search is good for finding rarely used properties of which the exact name is known, or to get inspired, for example, which fields are available related to the operating system (search for "operatingsystem").
Tip
If you do not know the name of properties in LOGINventory, you can always look at existing queries to see which properties have been selected.
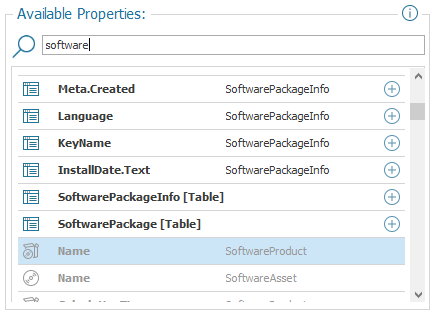
In addition to regular properties, the list of available properties also includes entire tables. These are marked by the addition of [Table]. If a [Table] entry is selected, all contained columns are expanded and added to the list of selected columns.
Count
To display the number of entries (e.g. installation, connections to the device, etc.) in queries, the keyword Count can be searched for. An entry with a sum sign will then appear under the available properties. If, for example, SoftwarePackage.Name and SoftwarePackage.Count is selected, the number of times each software package is installed is displayed behind each software package. 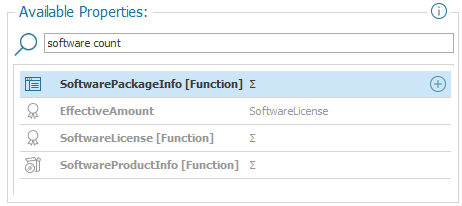 However, these entries cannot be used to filter in the query. This is only possible in the data view.
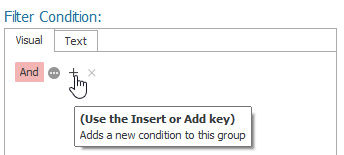
Filter Conditions
To filter for selected properties, they can be either selected
- from the left area with the available properties via drag & drop
- from the middle area with the selected properties via drag & drop
- or by clicking on the plus sign in the filter condition area.
Different (comparison) operators are then available, depending on the type of the selected property.
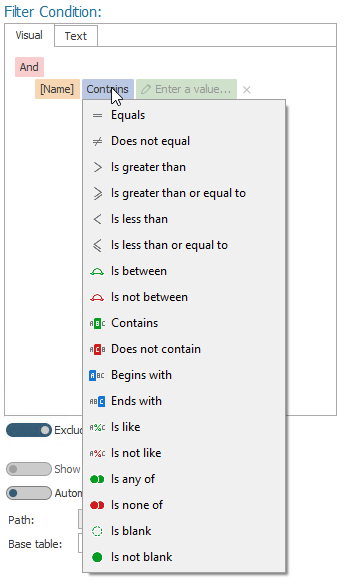
If a comparison operator has been selected, the element to be compared to can be defined. These can be strings, date values, relative dates, or other properties.
Several filter conditions can be linked with different operators (and, or, not and, not or) and structured in groups.
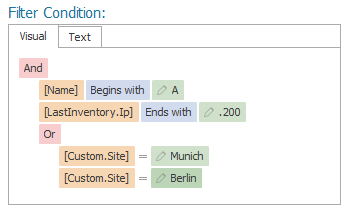
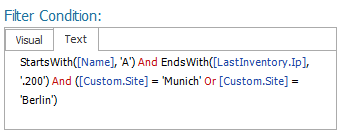
In addition to the visual representation of the filter conditions, a textual representation is also available, which can be used to edit larger filters with many conditions, e.g. in an editor.
Tip: Relative Date Filtering
If a relative date filter ("within the last 90 days", "in the next 30 days") is to be used instead of an absolute date filter ("before 1.1.2019"), the following procedure can be used:
A property of the type "DateTime" must be selected in the filter condition. By clicking on the value to be compared, an absolute date value can be selected via the drop-down menu. By clicking on the small arrows next to it, a relative date value can be set which can then be further adjusted. 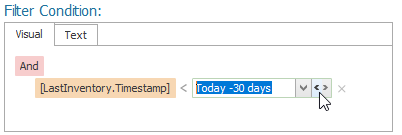
Templates
Templates can be used in order not to "start from scratch" when creating new queries, but to have a meaningful combination of selected properties directly available. By default, some templates are already provided. However, it is possible to define additional queries as templates.
Info
In templates, only the selected columns are saved, but no filter conditions. If it is desired to use both the selected columns and the filter conditions for a new query, the source query can be copied and pasted simply by using the context menu.
To save the selected columns of a query as a template, a template name can be assigned in the upper right corner. If the query is saved by clicking "OK" or "Apply", the template will be available for selection for new queries as long as no properties have been selected.
Attention
When selecting a template when creating a query, the template columns are always "expanded" (resolved). Therefore, a subsequent change to the original template query has no effect on queries that have been created using this template.
Layout
In the data view of LOGINventory, each user can make own, dynamic adjustments: Change column order, filter, hide columns, sort. These customizations in the Data View are user-specific and will be saved for each user, so that these customizations will still be valid during the next node visit. In contrast, there are also global adjustments to the layout, which are made in the Query Editor.
Info
User-specific adjustments always have priority over global adjustments of the layout. This way, each user can define his or her own "favorite order" for columns etc.
Attention
When editing an existing query, the user-specific layout (if available) is always taken over and saved as global layout, if the query editor is not closed with "Cancel". This global layout is also used by the web viewer, but can be overridden by user-specific adjustments.
Example
User A creates a new query named "Evaluation1" which displays Device.Name, LastInventory.Timestamp and DeviceInfo.ChassisType. This sequence is thus saved as User-Specific Layout for User A and as Global Layout. User B adjusts the order of this query in the data view (without opening the query editor) so that the column DeviceInfo.ChassisType is in second place. This adjustment is only valid for user B, because it was not made in the query editor and therefore was not saved as global layout.
If user B decides to add the column OperatingSystem.Name to "Evaluation1", he has to open the query editor. User B adjusts the column order in the query editor as follows: Device.Name, OperatingSystem.Name, DeviceInfo.ChassisType, LastInventory.Timestamp. By saving the query, this order was defined as a global layout, and is thus also displayed for user C, who now clicks on this query for the first time and thus did not yet have a user-specific layout for this node.
When user A now clicks on the query, his user-specific layout is loaded (Device.Name, LastInventory.Timestamp, DeviceInfo.ChassisType). However, the query has added another column for which no position is stored in User A's layout, so it will be added at the end.
Tip
If a column is hidden in the data view (drag & drop of the column name upwards until a black X appears), and then the Query Editor is opened, the hidden column is grayed out and cannot be moved forward in the column order. 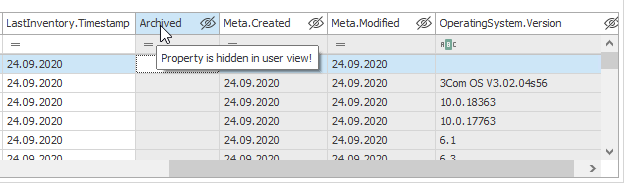
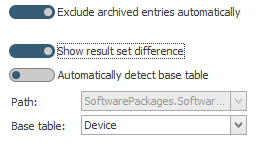
Inverting the Result Set
In some query structures, you may want to display unaffected results or invert the found set. For this purpose, the "Show result set difference" slider can be selected in the query editor.
Example
To be able to evaluate in a structure on which devices Flash Player is installed and on which not, you can proceed as follows:
- Create query: SoftwarePackage.name contains Flash Player
- Right click on the query -> New query -> Device: This query shows all devices on which Flash Player is installed.
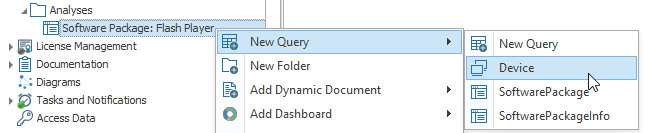
- To see the devices without Flash Player, this query must be edited and the "Show result set difference" slider must be clicked. This inverts the result set.
Tip
If you just want to know on which machines a package is not present and do not need this evaluation in the future, it would have been faster to use the Related Data widget to perform this evaluation and click the - sign in the widget.
Base Table
For technical reasons, each query must have a so-called base table. This base table specifies the main entity of the query and is almost always selected automatically based on the selection of properties. Only in a few cases, is it necessary to adjust the base table manually. The main entity of each query can be read in the data view from the name in square brackets after the query name. The main entity also determines which icon is automatically selected for the query.
The main entity of a query is also important in many other places, e.g. when using reports, custom properties or custom actions, because there you have to specify to which entity they can be applied to.
There must be paths (relations) from the base table to the properties that are not part of the base table.
LOGINventory generally stores all information in two table classes:
- Catalog tables contain the basic information, e.g. names of software packages or video adapters and when they were first discovered in the data acquisition process.
- Link tables contain current individual information such as e.g.
- for software packages, installation date and location, license key, product ID, etc.;
- for video adapters, the driver version, RAM size, etc.
Info
Link tables link the underlying catalog table to the information of the device (asset). Names of link tables always end with "Info".
Example
If a new query should display the operating system name (Operatingsystem.Name) in addition to the device name (Device.Name), the two properties can be easily selected. Among others, Device and OperatingSystemInfo are then available as possible valid base tables. If the OperatingSystemInfo base table is set manually by the user and the query is saved with "OK", no more values can be stored on the devices in this view via the "Custom Properties" widget, since the Device base table required for this, is not selected.
Query Options
The query options can be opened by clicking on the formula icon next to a selected property.
Up to two different options are available here, depending on the current selection:
- Aggregate Function: Can be used to apply an aggregate function (e.g. Min, Max, Count, Average, etc.) to the selection. Application is shown in the examples below
- Path: There can be different paths between different entities in terms of database technology. If multiple paths are available between the selected entities, a selection is possible here. In most cases, however, the path is unique.
Examples for Own Queries
List of Computers that Have Software A and Software B Installed
- Create a New Query (for example below the node Analyses)
- Either select a template with device information
- or select the columns that are of interest (e.g. Device.Name and Operatingsystem.Name)
- Add a filter condition (top right via the plus sign):
SoftwarePackage.name contains "7-Zip" - Add one more filter condition (top right via the plus sign):
SoftwarePackage.name contains "Acrobat" - Customize the query name to "Assets with 7-Zip and Acrobat" in the top left of the query editor
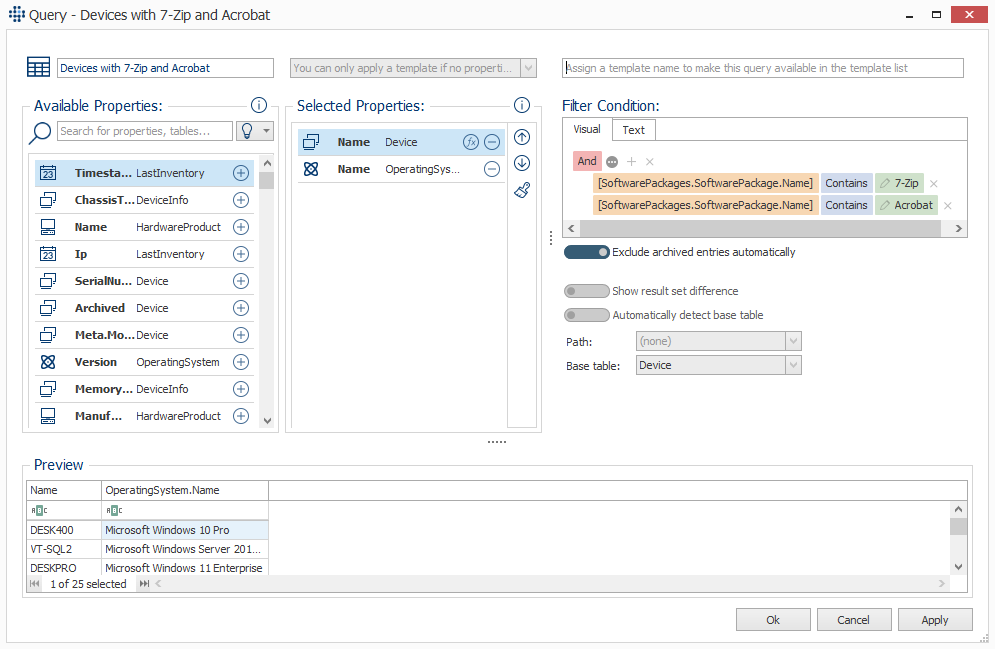
Tip
If you want to display devices that have 7-Zip OR Acrobat installed (or both), you can switch to “or” by clicking on the “and” sign. 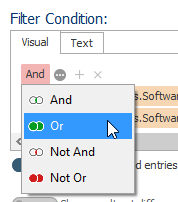
List of Computers on Which a Software Package is not Installed
- Create a New Query (for example below the node Analyses)
- Either select a template with device information
- or select the columns that are of interest (e.g. Device.Name and Operatingsystem.Name)
- Add a filter condition (top right):
SoftwarePackage.name does not contain "Adobe Photoshop" - Customize the query name to "Assets without Photoshop" in the top left of the query editor
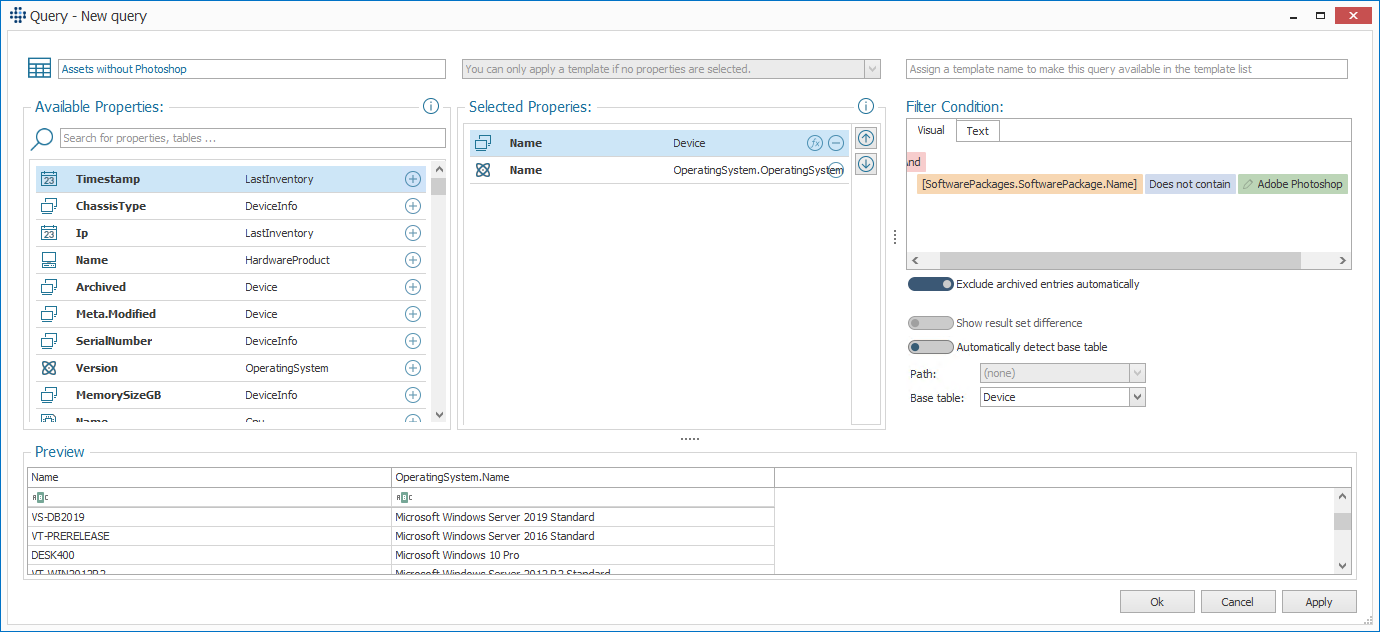
Danger
Be careful not to select the column "SoftwarePackage.Name," as this would change the base table from "Device" to "SoftwarePackageInfo," resulting in all installations being displayed except for the ones filtered out.
Tip
Another, possibly even faster alternative to obtain this data (not as an exportable list, but for viewing purposes) is to use the Related Data widget on a "SoftwarePackage" query. There, you can click on the - sign to display all devices that do not have the selected software package installed. 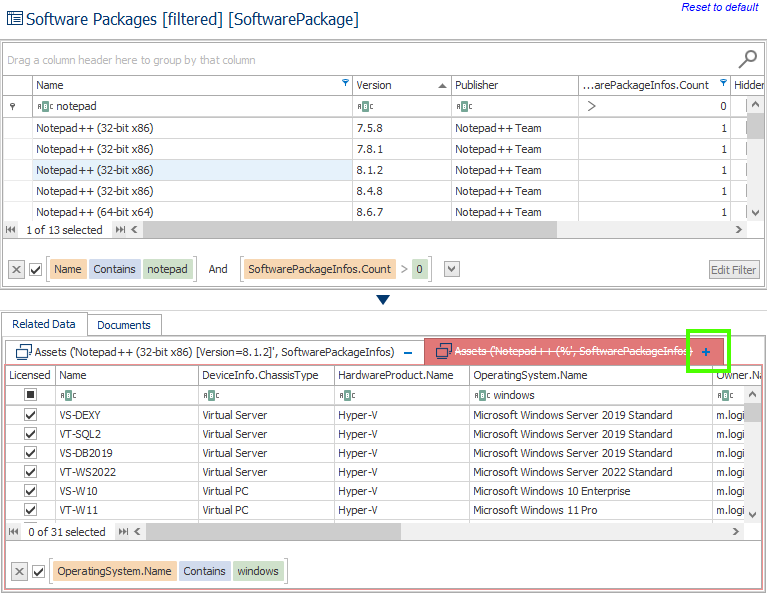
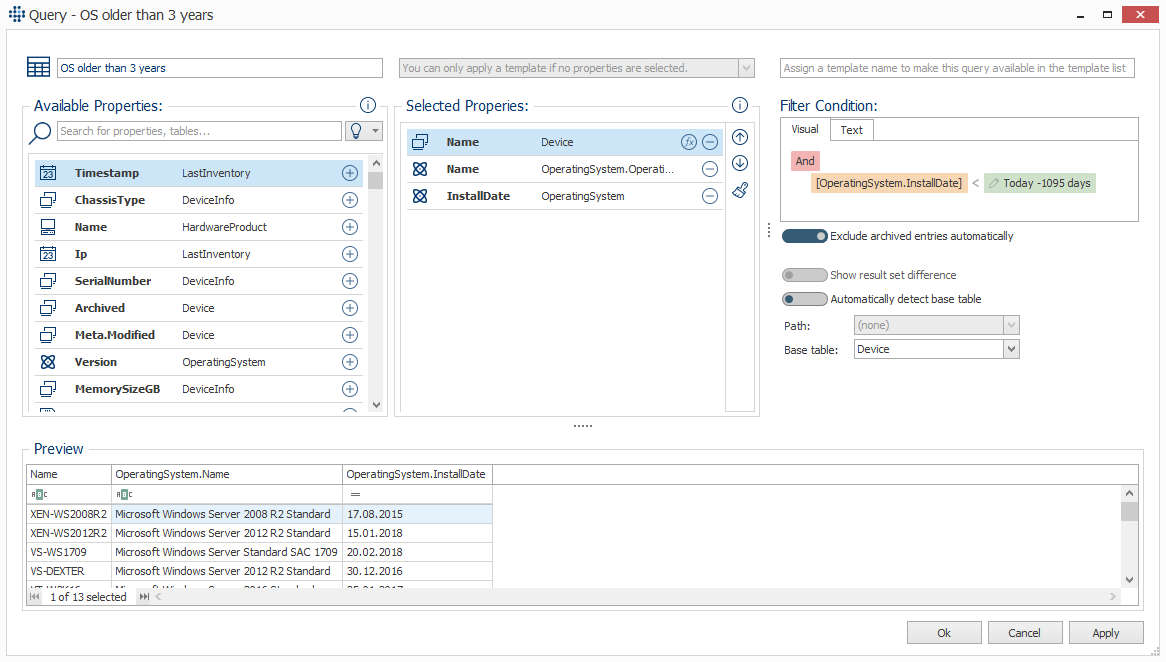
List of Computers Where the Operating System was installed more than 3 Years ago
- Create a New Query (for example, below the node Analyses)
- Either select a templatewith device information
- or select the columns that are of interest (for example, Device.Name, OperatingSystem.Name and OperatingSystem.InstallDate)
- Add a filter condition (top right):
OperatingSystem.InstallDate is smaller than Today -1095 daysNote: by clicking on the arrow icon (left or right) you can work with relative values likeToday+30 daysfor DateTime entries. - Customize the query name to "OS older than 30 days" in the top left of the query editor
Tip
To receive a monthly email with the list of affected computers, a Task can be positioned on this node via the ribbon menu.
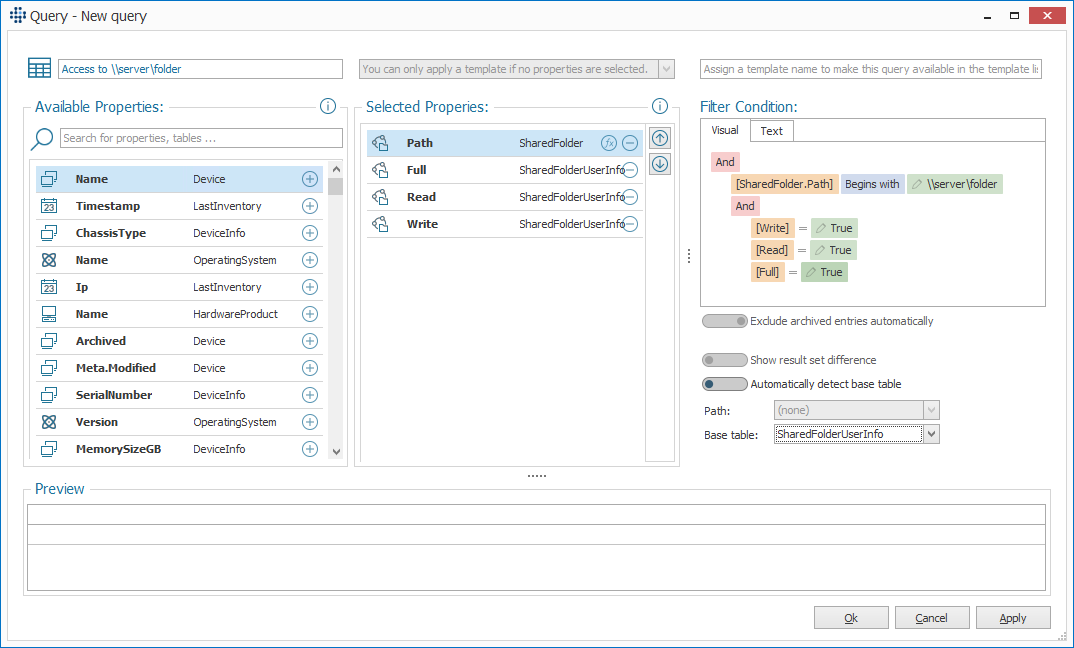
List of Users Who Have Access to a Specific Folder
- Creating a New Query (for example, below the Analyses node)
- Selection of columns User.Name, SharedFolder.Path, SharedFolderUserInfo.Full, SharedFolderUserInfo.Read and SharedFolderUserInfo.Write
- Add a filter condition: Drag and drop the column name "SharedFolder.Path" from the property selection to the filter area:
SharedFolder.Path starts with \\Server\Folder. - Add another group to the filter conditions by clicking on the three points and selecting the operator
orfor this group. - Add filter conditions
Full equals true,Read equals trueandWrite equals true. - Rename the query to "Access \\Server\Folder"
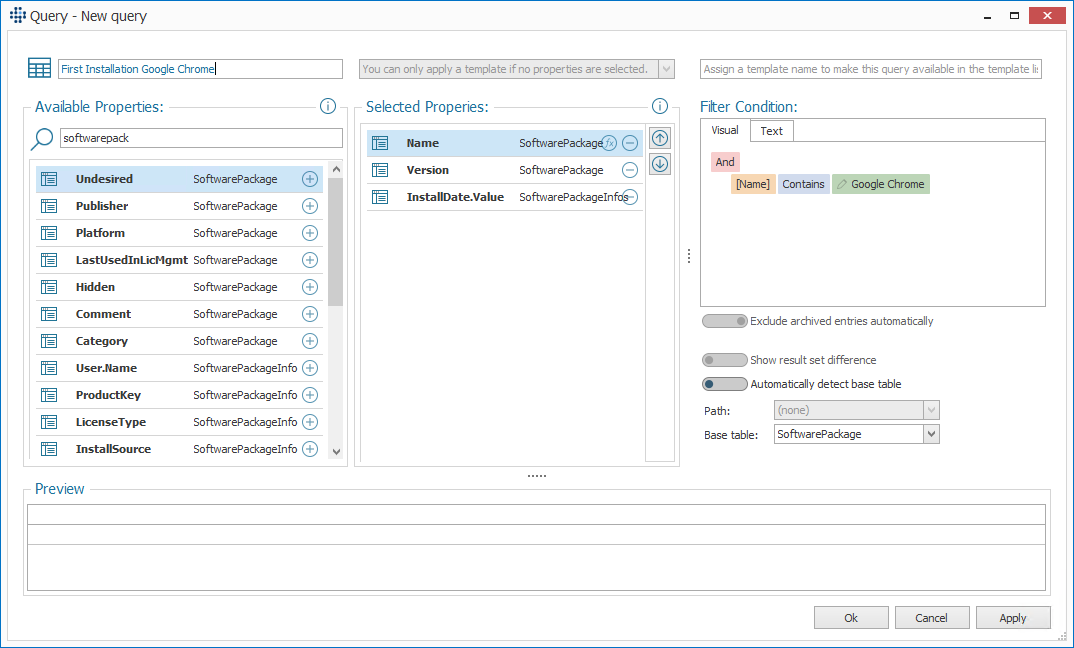
First Installation of a Software Package
- Create a New Query (for example below the node Analyses)
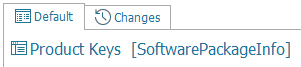
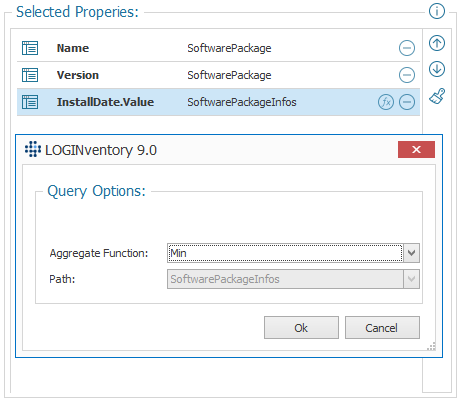
- Select the columns SoftwarePackage.Name, SoftwarePackage.Version and SoftwarePackageInfo.InstallDateValue
- Change the base table from 'SoftwarePackageInfo' to 'SoftwarePackage' (Note: Here, the base table must be selected manually, otherwise a result line is written for each installation in the network. However, the software catalog is now required here, which does not list multiple installations of the same software more than once).
- Click on the formula symbol at the entry InstallDateValue at the Selected Properties.
- Select the aggregate function Min, which calculates the earliest entry
- Drag & drop the SoftwarePackage.name from the Selected Properties to the Filter Conditions and add e.g. the filter
Name contains Google Chrome, to search for the first Google Chrome installation in any version. - Assign a meaningful query name, e.g. "First Installation Google Chrome"
Sum of Hard Disk Sizes per Device
- Create a New Query (for example below the node Analyses)
- Select the columns Device.Name OperatingSystem.Name, DeviceInfo.ChassisType, HardwareProduct.Name and DriveInfo.Size
- Change the base table from "DriveInfo" to "Device"
- Click on the formula symbol at Drives.Size at the Selected Properties
- Select the "Sum" aggregate function
- Add a filter
OperatingSystem.Name contains Windows - Rename the query to "Sum of Disk Sizes"
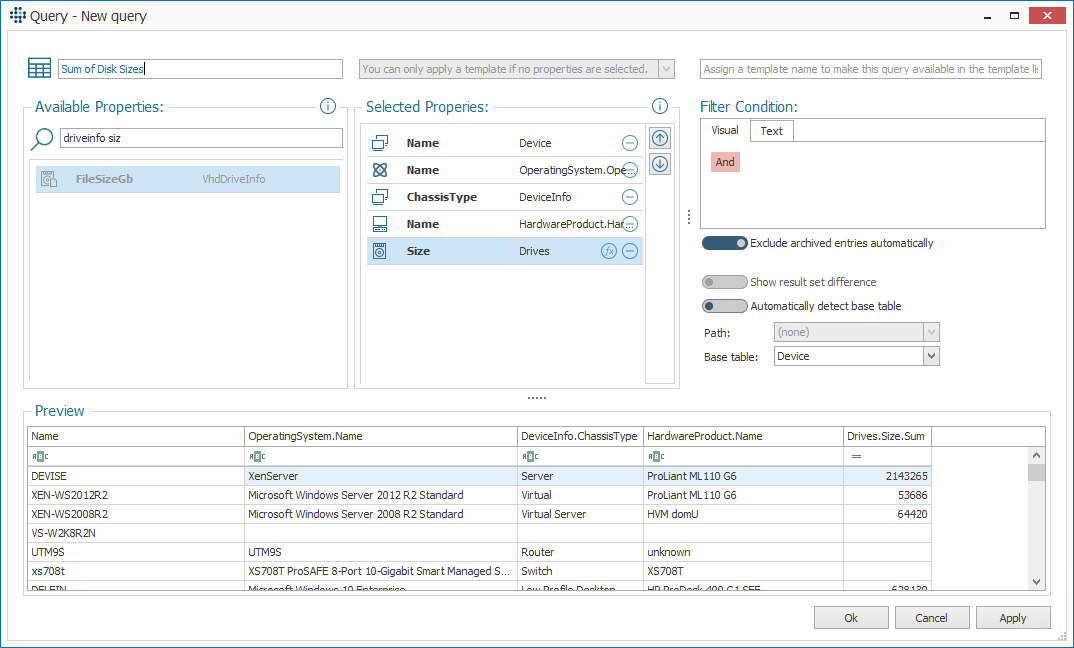
Info
Whenever there is no unit behind size specifications, the specification is in MB. To perform a conversion to GB, the query could be used in a dynamic document.
Editing Nodes and Adjusting the Tree Structure
Nodes can be
- moved to another position in the tree using Drag & Drop,
- renamed by double-clicking on them,
- reset to the delivery state via the context menu,
- duplicated,
- copied
- pasted as a copy,
- pasted as a link to the master (node that was copied). As a result, all changes below the original (adding further nodes, etc.) are also copied from the linked node.
- exported and saved as .ndef,
- imported (from a .ndef file).
Node Properties
A right click on a node (folder or query) opens the node properties under Edit.
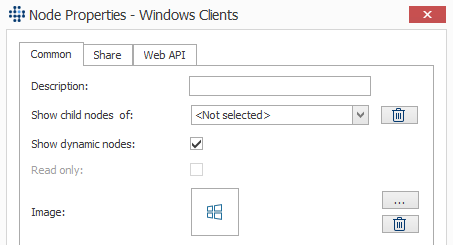
A description can be stored here, you can define from which node the subnodes are to be displayed, and you can select whether dynamic nodes are to be displayed. In addition, a separate icon can be stored for each query. There are already several icons to choose from and you can also add your own. The recommended resolution is 16 x 16 pixels.
In the tab Share, the node (including all subnodes) can be shared. Read more here.
In the tab Web API, you can configure an Web API endpoint and retrieve a URL for the General Web API.
Multiple Use of Query Structures
In LOGINventory it is possible to display the queries below a "master" query also below linked queries. Since these observe the inheritance in each case, the matching result rows are thus displayed in each case for hierarchical structuring.
To define a node as a "master structure", it is copied normally via the context menu. When pasting, however, the option Create and link to master is selected (in contrast to normal copying).
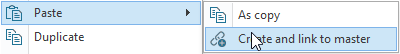
All changes to the master structure are mirrored by symbolic links to the linked structures. Changes are only possible to the master structure. This is particularly suitable for the use of centrally managed structures at different company locations.
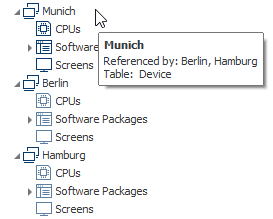
Thus, if in this example another query is added below the "Munich" node, it will automatically be available below the "Berlin" and "Hamburg" queries.
Tip
Using master structures means that changes that are to apply to all linked structures only have to be made once (namely to the master structure).
Tip: Parameterized Node Naming
When assigning nodes in the tree structure (queries, folders, dashboards, etc.), it is also possible to work with parameters so that the name of the node is composed of the nodes above it. If a number is written in curly brackets in the node name, this number indicates from how many levels above the name is to be taken.
For example, if CPUs {1} is chosen as node name, then in the above example it becomes CPUs Munich, CPUs Berlin & CPUs Hamburg. If CPUs {2} was selected as name, the display name would be CPUs Sites in all three cases. 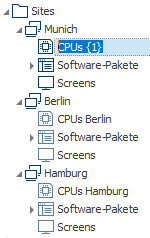
Change History
For each table, you can specify whether changes are to be logged or whether only the current status is available. By default, change history capture is already enabled for most tables, but can be customized via Settings.
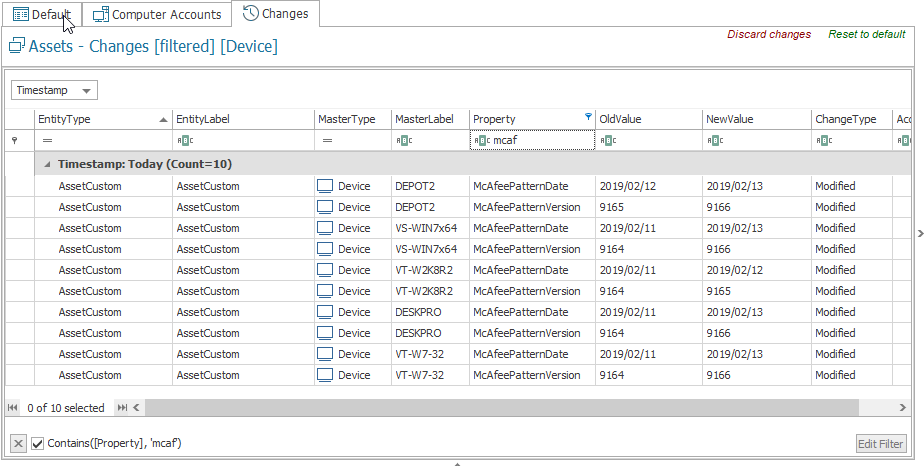
If the changes are entered for a table, the Changes tab is available.
Tip
By default, this view is grouped by timestamp, resulting in a logarithmic date scale. If you want to see the exact timestamp of the change, why not ungroup it by right-clicking on the "Timestamp" column title.
Depending on which query or node you are on, only the changes for the query results are displayed here. So if you want an overview of all changes in the network, you should look at the change history for the Assets node. However, if only the changes to a specific device are of interest (e.g. for troubleshooting), the device can first be selected by double-clicking and then switched to the Changes tab. In the change view itself, you can of course filter, group, etc. as usual in order to access the information that is of interest.
Lifecycle Entries
The change history automatically logs changes that are detected, for example, as a result of changed values when devices are scanned. However, if changes, notes, events, dates, etc. are to be logged manually, lifecycle entries are suitable for this purpose.
Lifecycle entries must be linked to an asset to which they refer.
Creating Lifecycle Entries
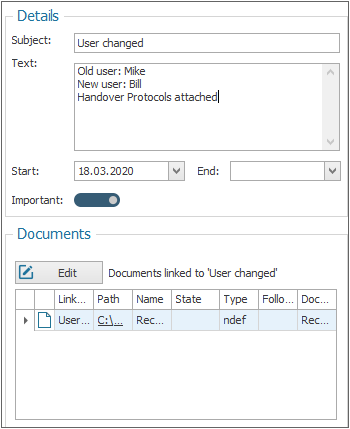
When creating lifecycle entries, various fields are available.
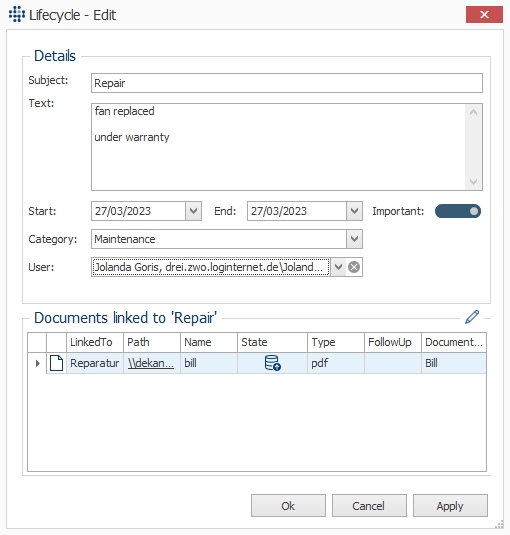
For each entry, start and end date, (single-line) subject, a detailed multi-line text, a category, and a linked user can be selected. Additionally, corresponding documents can be attached to each entry. Furthermore, an entry can be marked as important.
Tip
For subject and category, suggestions are automatically generated based on the values created so far.
The behavior when storing documents corresponds to the documents widget. However, the documents stored here are directly linked to the lifecycle entries and are therefore suitable for storing repair documents, handover protocols or similar.
There are several options for creating new entries in LOGINventory:
Creating via Info Widget
If you select an asset in the data view and the Info Widget is expanded, you can view the entries stored on the device in the Lifecycle area and create new entries by clicking on the plus sign:
Info
The Info Widget always shows data only if exactly one asset has been selected. However, if the same lifecycle entries are to be stored on several devices, it is possible to store them via the ribbon menu.
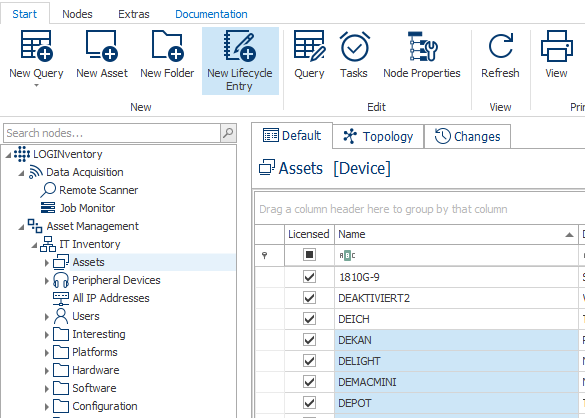
Adding via the Ribbon Menu
If one or more assets have been selected in the data view, the option to create a New Lifecycle Entry appears in the ribbon menu. If this option is used to create an entry on multiple devices, an identical copy of the newly created entry will be created for each asset.
Info
If an entry created by this method is to be edited afterwards, it must be edited individually on each asset!
Creating Entries Using the Hand Out / Return Process
By using the hand out / return process in LOGINventory, lifecycle entries (incl. signature) are automatically generated, which are linked to the respective devices and users.
Creating via PowerShell
Using the PowerShell command Add-LiLifecycleEntry a new lifecycle entry can be stored script-based at a device.
Evaluations for Lifecycle Entries
In LOGINventory, the information stored as lifecycle entries can be evaluated in many places. For example, the query Lifecycle Entries gives an overview of all entries created so far:
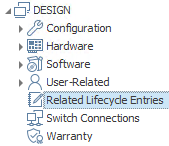
Likewise, the entries are displayed below assets or users:
In the info widget and in several included reports (especially "Lifecycle Overview") the entries are also evaluable.
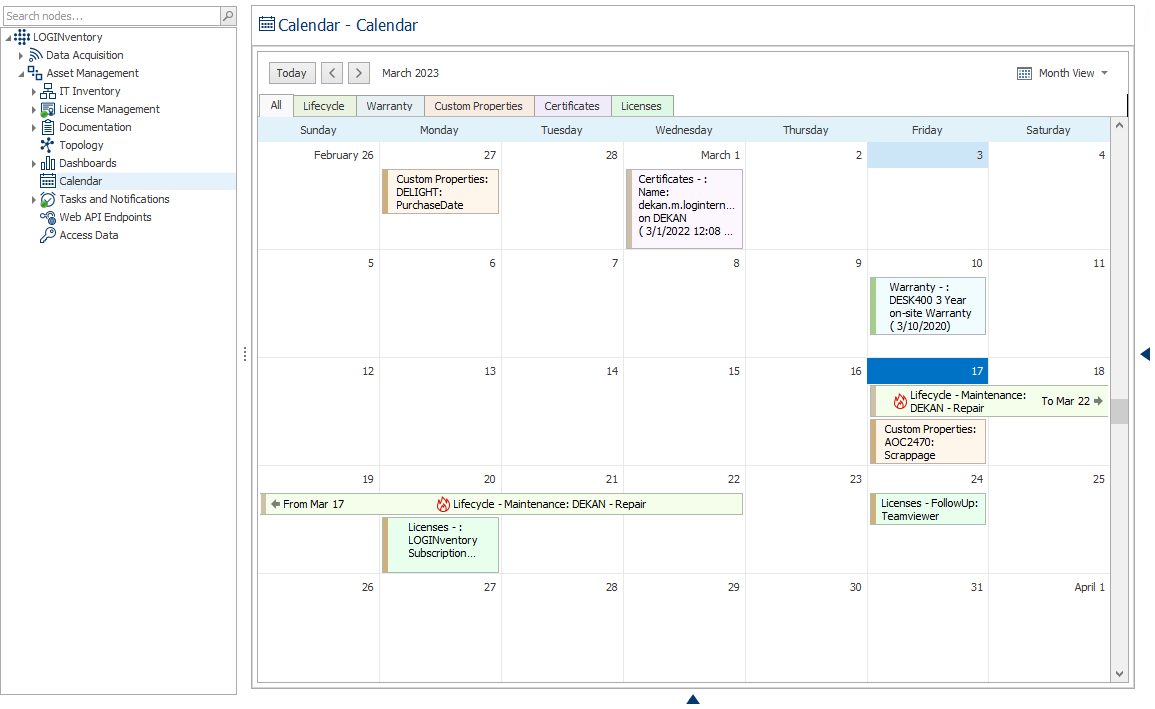
In addition, all lifecycle entries are also displayed in the calendar view. This view makes it very easy to see which events occur when, which time period they have covered, etc..
Tip
Of course, you can also create your own queries at any time that filter for specific lifecycle entries.
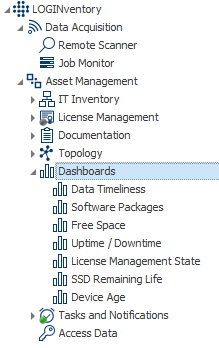
Dashboards
Similar to Queries, Reports, etc., LOGINventory also allows to create own dashboards or edit existing dashboards.
Interaction with Dashboards
By default, dashboards are located on the Interest, Platforms, Hardware, Software, Configuration, Active Directory, and Microsoft Exchange folders; also below the Dashboards node.
These dashboards usually consist of several charts that provide the following functions:
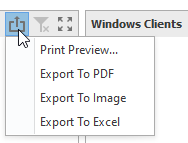
- Export: The charts or the entire dashboard can be printed or exported to various formats.
- Maximize: A diagram can be maximized.

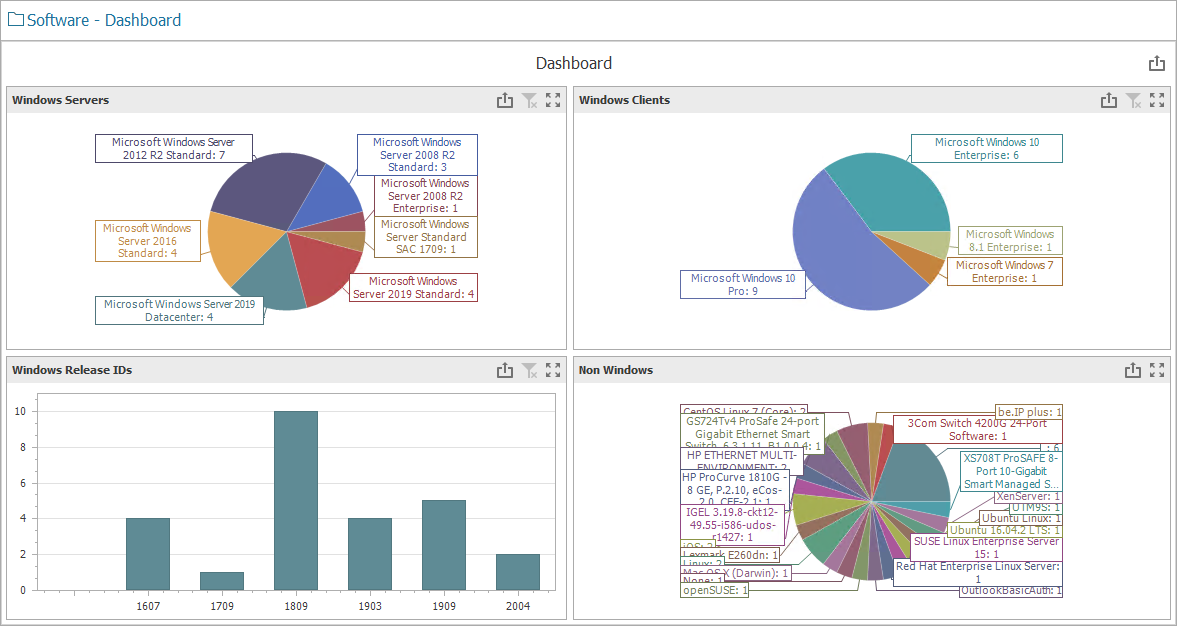
- Filtering: By single clicking on a data point, other diagrams are filtered - depending on the configuration. For example, a single click in the Software dashboard on a bar in the Windows Release IDs diagram causes the other diagrams to display only operating systems with this release ID. This filter can also be removed again by clicking on the Delete Master Filter icon.
- Drill-Down / Drill-Up: Double-clicking on a data point filters other diagrams - depending on the configuration - and simultaneously jumps one level lower. For example, a double click in the Platforms dashboard on the Windows part of the pie has the following consequences: The Platforms dashboard will only show Windows operating systems and the Platforms diagram will show the individual Windows versions one level lower. By clicking on the drill-up arrow you can jump back to the higher level.
Info
Filtering or drill-down is only possible if this has also been enabled in the definition of the dashboard, which is not always the case with the delivered dashboards.
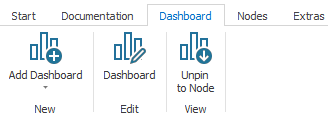
Editing Dashboards
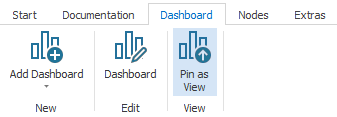
To create new dashboards, edit existing dashboards, display them as nodes or store them as views, you have to switch to the Dashboard ribbon menu.
When creating new dashboards, you need to select an entity to which the data in the dashboard should refer. The available entities can be edited in the customize settings.
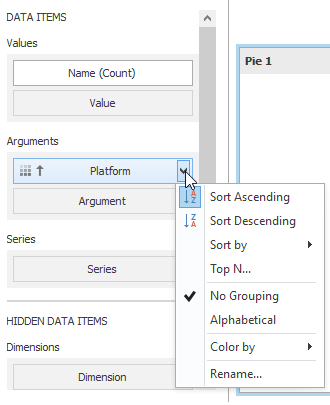
The Dashboard Editor opens in a new window. Here you can add and edit various elements such as tables, charts, filters, titles, etc. To fill the elements with data, properties from the left data source area can be dragged and dropped onto the data items part.
If the properties have been defined as a data item, further settings such as sorting, calculation color and naming can be set here.
If several elements have been added to the dashboard, they can be arranged via drag & drop.
Info
In the Dashboard Editor, only a preview of the first 100 data records is loaded by default. Sometimes it may be necessary to increase this limit, but this will result in longer loading times. The limit value can be adjusted in the Data Source tab: 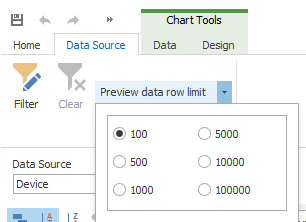
Tip
A detailed manual that describes all functions of the dashboards can be found here.
Positioning of Dashboards
Important
Dashboards can be created individually as nodes in the tree structure or defined as a view for a node above it (e.g. a folder).
When a new dashboard is created, it is initially available in the tree structure like any other node.
However, the Dashboard ribbon menu also offers the option to pin the dashboard as a view to the node above in the tree structure.
For example, it is useful to display dashboards on folders because the folders in LOGINventory do not have any representation in the data view. However, dashboards can also be pinned as a view for normal queries and are then available as another tab.
Tip
You can also use dashboards for nodes that display an information page by default, such as Asset Management, IT Inventory, etc. In this case, the dashboard is automatically displayed when the node is clicked. 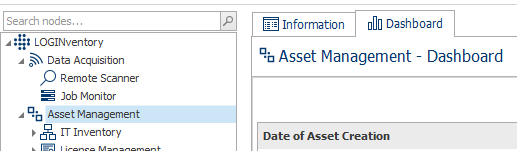
Info
Only one dashboard per node can be pinned as a view. If another dashboard is pinned anyway, the first pinned dashboard is displayed as a node again.
Attention
Dashboards - just like queries - take into account the structure above them, which serves as a pre-filter. Thus, depending on the position in the tree structure, a dashboard may show different data if the query(s) above it restrict the result set.
Dashboards can also be viewed in the Web Console.
Network Topology View
The use of the topology function is explained in detail in the corresponding chapter.
AD Matching View
The AD Matching view is available for all queries with the base table "ComputerAccount", i.e. by default the query "AD Computers".
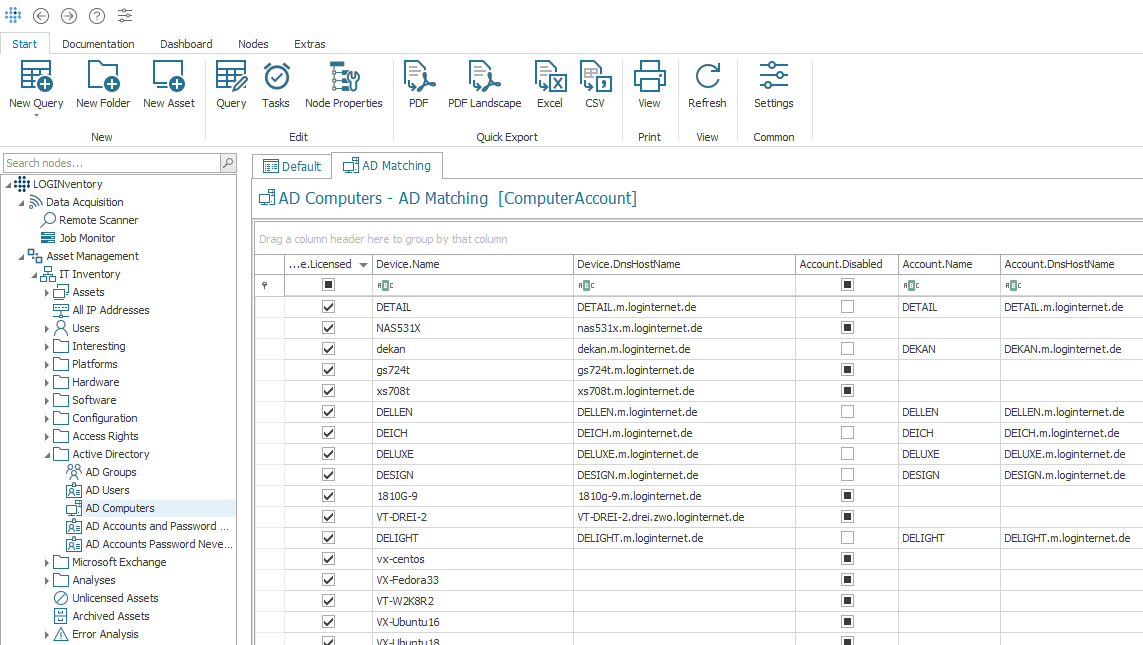
The inventory data is displayed linked with the corresponding data from the Active Directory (Device.Name ↔ Account.Name). This makes it easy to see,
- which devices are present in the AD, but not in LOGINventory (no entry in Device.Name)
- which devices are not present in the AD, but still in LOGINventory (no entry in Account.Name)
- which devices are deactivated in the AD, but are still present in LOGINventory
- etc.
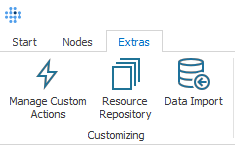
Customizing
LOGINventory can be easily adapted to your needs with the help of customizing.
Custom Actions
From every query node it is possible to start external programs and supply them with parameters from the database - if these actions were defined here before. External programs, e.g. helpdesk systems, can be connected via this interface.
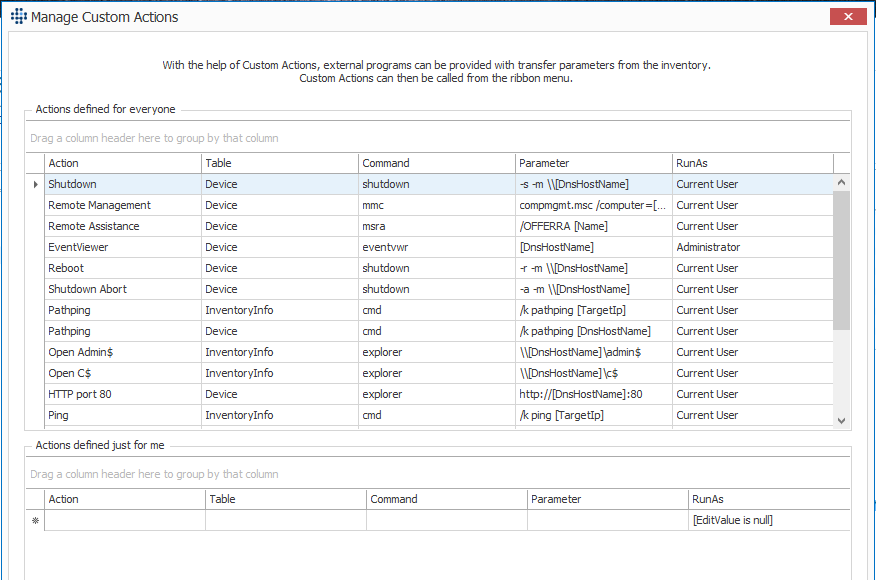
Depending on the table selected in the Custom Actions, the possible actions appear in the ribbon menu as soon as the corresponding entry is selected in the results view. If, for example, an asset is selected, the supplied actions for Remote Management and Remote Desktop, etc. are displayed. These can then be applied to an asset.
When creating new actions, you can specify whether the actions are to be available for all users or only for the current user.
A Custom Action consists of
- the name of the action
- of the table to which the action refers
- the command to be executed
- parameters that are to be passed
- and a user to execute the action (RunAs)
Example
To define a new action "Wake on LAN", the command MagicPacket.exe -mac <MAC-address> must be executed. To do this, select MagicPacket.exe from the command and enter -mac [LastInventory.Mac] as the parameter.
After creating a new action, it may be necessary to restart LOGINventory.
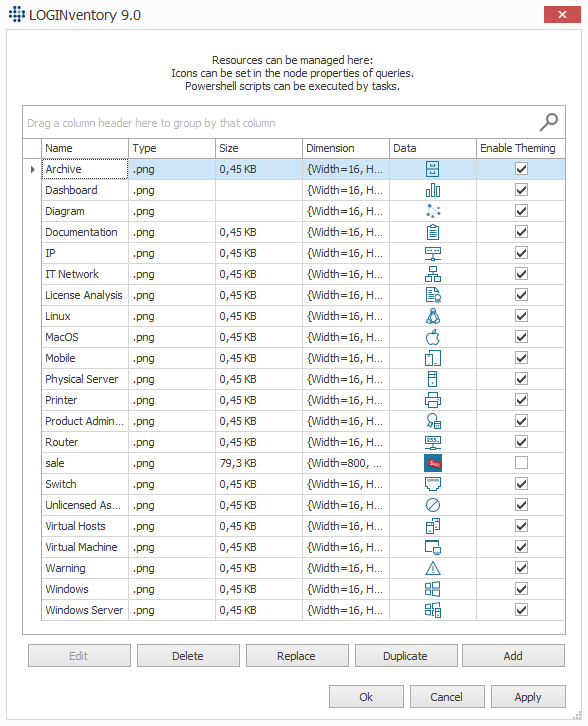
Resource Repository
Files that belong to the Resource Repository are managed in the database and are available at different places in LOGINventory. By default, various png files already exist that can be used to assign another icon to a query. In addition, PowerShell scripts that were deposited with the Tasks appear here. If these scripts are adapted here, this adaptation applies to all tasks that refer to the respective script.
Info
If you add custom images, you can choose whether the icon should be colorized when enabling theming. Often, it is reasonable to deselect this option for custom images.
Additional Data
Data Import
Data can be imported from .csv files using the data import function. This can be used, for example, to manually create assets, fill in your own properties or import licenses. The data import is described in detail here.
Warranty Data
LOGINventory offers the possibility to automatically read out warranty information from selected manufacturers online and to display it in the user interface. It is also possible to manually enter warranty information.
Info
The warranty data retrieval is not switched on by default and must be activated manually once so that the data is retrieved automatically in the future.
Important
It cannot be guaranteed that the warranty information can be read permanently. Hardware manufacturers may adjust their websites / interfaces or take them offline. However, we try to react as soon as possible to any changes and read out as much information as possible from the different manufacturers.
List of Supported Manufacturers
In order to automatically retrieve information online, the serial number determined by LOGINventory is transferred to the respective manufacturer's website / interface if an Internet connection is available. Depending on the entry in the field HardwareProduct.Name, it is decided from which manufacturer the data will be requested.
| Manufacturer name | Possible entries at "HardwareProduct.Manufacturer" | Supported device types | Additionally passed parameters |
|---|---|---|---|
| Dell | Dell, Dell Inc. | Desktop, Laptop | - |
| Fujitsu | Fujitsu | Desktop, Laptop | - |
| IBM | IBM | Server, Switch | HardwareProduct.Name (model number in square brackets) |
| HP disabled | HP, Hewlett-Packard | Desktop, Laptop | HardwareProduct.SKU |
| Lenovo | Lenovo | Desktop, Laptop | - |
HP: API disabled in Jan 2023
Unfortunately, HP has deactivated the Warranty API, so that no queries are currently possible through it.
Warranty Data Collection
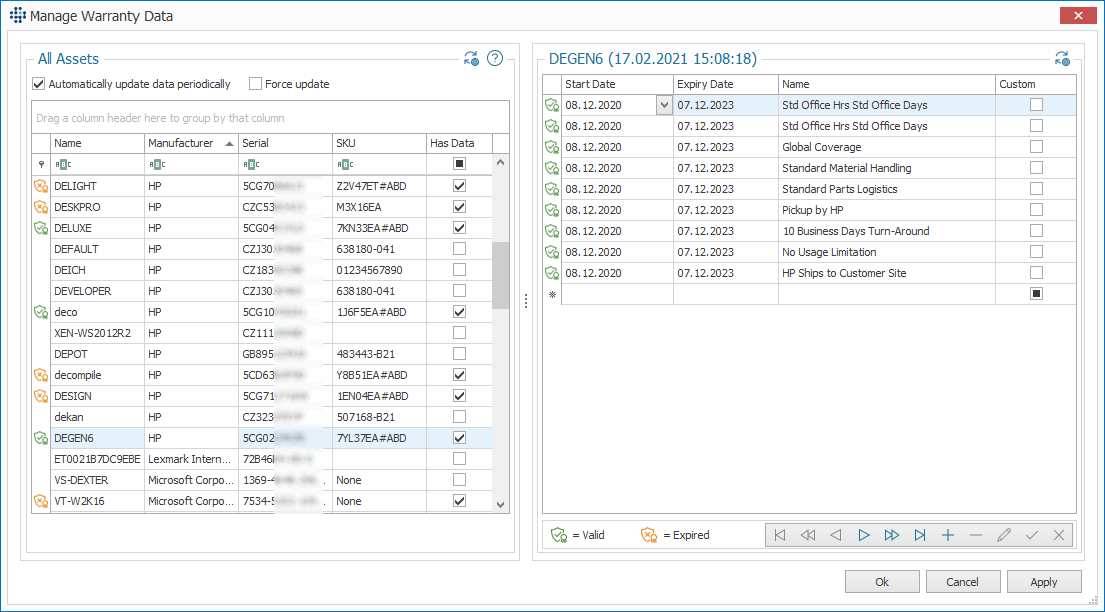
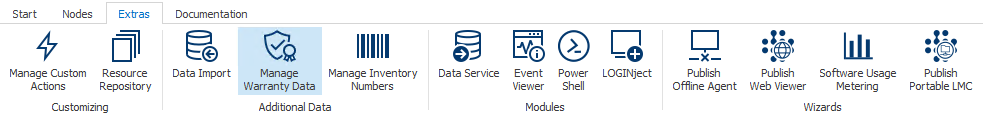
Via the ribbon menu Extras the menu item Manage Warranty Data can be called.
This overview shows for which assets warranty information has been retrieved. Here, also the new data retrieval can be triggered.
Info
By default, warranty information is not automatically retrieved online. This behavior can be changed by checking the checkbox Automatically update data periodically. This will attempt to update the information daily between 5 and 7 a.m..
This option is not available in the Portable Version. In the portable version, the option looks like this: 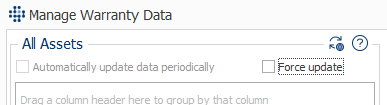 Use the installation on the LOGINventory server to turn on this option.
However, all data requested online will be cached for 30 days and will only be requested online again after the 30 days have expired to avoid unnecessary requests. As a result, after an initial collection, warranty information is normally only queried online for new devices added to LOGINventory (until the 30-day cache expires). However, by checking Force update, the presence of cache data can be ignored and the updated online collection can be forced by clicking the Update button in the upper right corner.
Similarly, when a device is selected and the button to update that device is clicked, it will force the update as well.
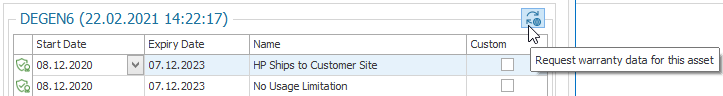
Warranty information can also be stored manually for the devices, e.g. if the manufacturer does not support the automatic collection by LOGINventory, or additional warranty information is known that cannot be queried online. For this purpose, either an empty line can be filled freely or an empty line can be added via the plus sign at the bottom.
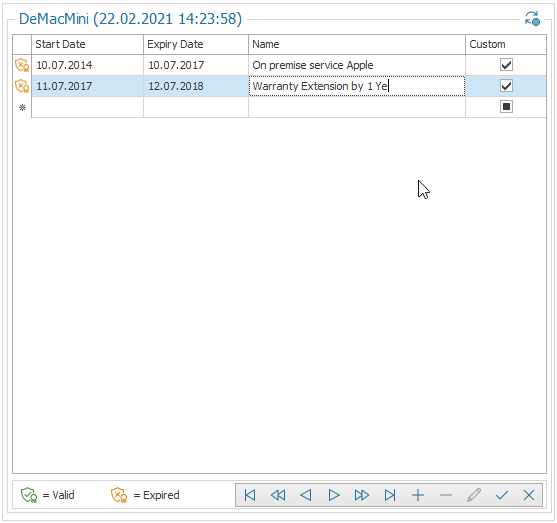
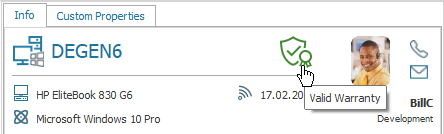
If warranty data is available, the current warranty status is displayed by means of an icon in the Info Widget. The warranty is valid if at least one warranty entry is still valid. If all stored entries end in the past, the icon indicates an expired warranty. If this warranty icon is clicked in the info widget, a window opens in which all known warranty information for this device is displayed and additional information can be stored manually.
Info
All warranty entries are stored in the Warranty entity as a 1:n relationship to the device and can be used in queries, for example. Likewise, the properties WarrantyStart and WarrantyEnd are also created as a 1:1 relationship to the device, containing the earliest start date and the latest expiration date, respectively. These values can then be used in dashboards, for example, when evaluating where the warranty expires and when. The WarrantyStart property can often also be used to deduce the purchase date of the device.
Manage Inventory Numbers
LOGINventory offers the possibility to automatically assign inventory numbers for assets. If the option is enabled, all newly entered / created assets & peripheral devices automatically receive the next free inventory number. This is stored in the InventoryNumber field and can be used as usual in Queries.
Important
Inventory numbers are especially important for handing out and returning assets to users, in order to be able to clearly identify which device you have in front of you. Therefore, inventory numbers are used, among other things, in the QR code labels and thus in the links to the detail page in the LOGINventory web interface.
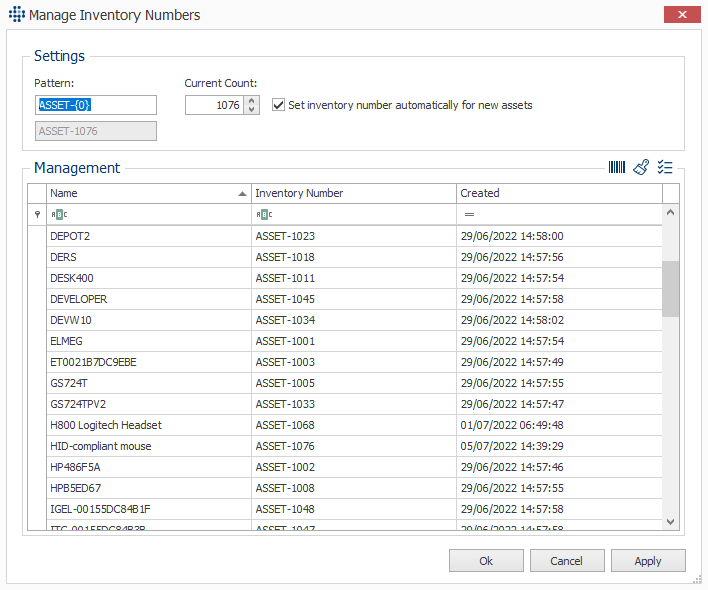
The inventory number management dialog can be accessed from the ribbon menu Extras.
The name pattern to be used can be specified in the Pattern field. The sequential number will be set at the position of the field '0'.
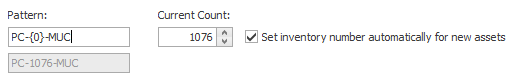
In the lower part of the dialog, the inventory numbers assigned so far can be viewed and adjusted if necessary. For this purpose, the three options to generate the inventory number, clear the inventory number and to select all result rows are available.

Tip
If there are already devices in your LOGINventory database that have not been assigned an inventory number (e.g. because the option to automatically assign was disabled), you can automatically assign an inventory number for all devices by first selecting all result rows and then clicking the button to generate the inventory number.
Info
If you want to assign a new inventory number to a device that already has one assigned, you must clear it first.
Tip
Normally all inventory numbers should be assigned automatically. If the inventory number of a device should be adjusted manually, you can switch to the edit mode by pressing the key combination STRG + E and you can now type in your own number freely.
If you have previously managed the inventory numbers of your devices in another system or in LOGINventory's Custom Properties, these can also be imported. To do this, you only need a .csv file that also contains the inventory number for each device name. To generate this list with LOGINventory, simply create your own query and export it. In the second step, the field can then be read in as InventoryNumber with the help of the Data Import.
Info
Inventory numbers can also be set via Powershell, e.g. to define a separate pattern for the assignment of inventory numbers in a script for each device type.