Evaluation
Different user interfaces are available for evaluating the data. By default, the LOGINventory Management Center (LMC) is installed with the installation of LOGINventory and is the tool of choice for most applications. However, if access is required from other computers on which LOGINventory is not installed (e.g. when installing the acquisition components on a server or for colleagues), there are various ways to access the database:
- By using the portable LMC, which can be started without installation for example from a network drive.
- By installing the LMC on the client computer and configuring the connection to the corresponding database in the configuration.When calling the LMC you can jump directly to a specific asset by using the parameter
/q:AssetName, e.g: "LOGINventory.exe /q:MyPcName" - By publishing the web interface. Attention: Here only a read access is possible! No change of queries or deposit of custom properties possible! In the web interface, you can jump directly to an asset by appending
?pcuid=Assetnameto the end of the URL, for example:http://server/LOGINventory8/default.aspx?pcuid=«Assetname»
Info
The user interface and operation of portable LMC and normal LOGINventory Management Center do not differ, but the acquisition can only be controlled by the non-portable version with actual installation.
Basic Operation
Operating Concept
The display and operation of the LOGINventory Management Center are based on the Windows Explorer. The tree view is located in the left area of the display, the result view is located centrally. The LMC uses the ribbon design concept, which dynamically displays menus depending on the current selection and position.
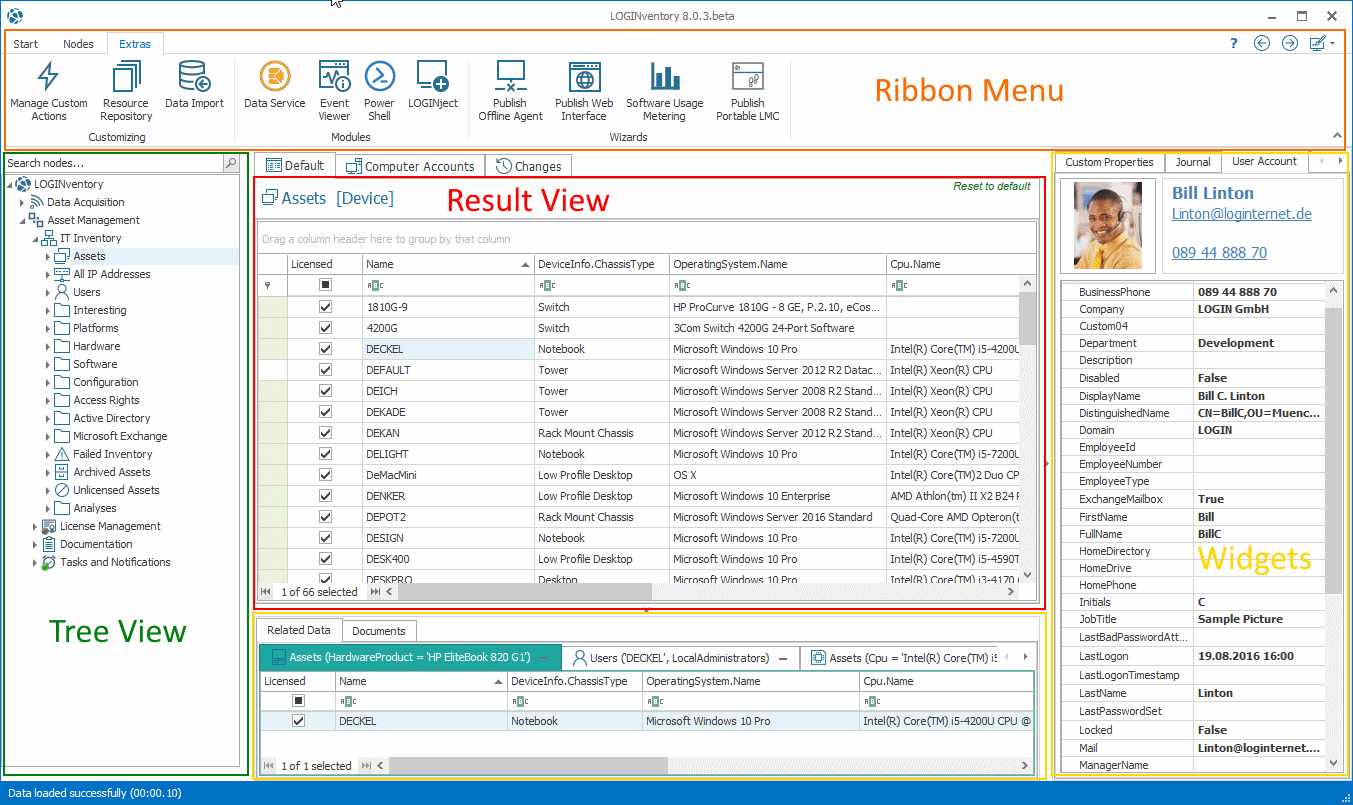 All successfully acquired devices are listed in
the Assets node. By double-clicking, the details of the respective computer are listed.
All successfully acquired devices are listed in
the Assets node. By double-clicking, the details of the respective computer are listed.
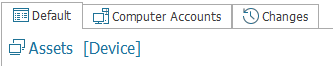
The view in the result view can be toggled with the tabs on the top. These tabs adjust dynamically depending on the selection in the tree view. The following views are available:
- Default: Current data
- Changes: Historical data
- Dashboard: Graphical Overview
- User, Computer Accounts: Additional data from the Active Directory
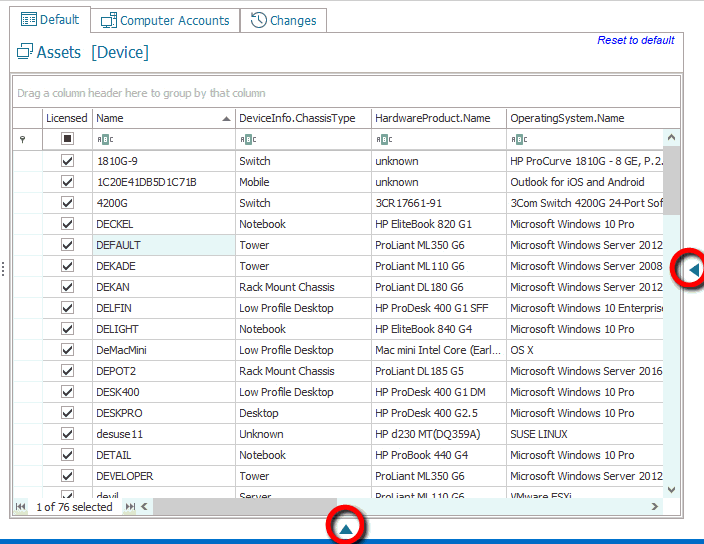
In addition to the functions displayed in the ribbon menu, context menu functions are always available using the right mouse button. With the widgets on the right side or at the bottom, which can be opened and closed by clicking on the small arrows, details are displayed in the result display according to the selection. If necessary, these can be edited directly there. The following widgets are available:
Right:
Down:
These are described in detail in the respective chapters.
In principle, the following actions can be performed in each view
- Set filter conditions
- Add or delete columns
- Jump to the details by double-clicking on a result row.
- Export the current view (including filter conditions etc.)
- Applying Reports to the Selection
The supplied tree structure can be adapted by the user as required. This is how you can
- create own queries (by selecting desired columns and setting filter conditions)
- create folder structures (for rearranging and grouping queries)
- adapt, copy and delete existing queries
- reset the supplied nodes to their factory defaults.
Attention
The assets are not physically below a specific query or within a folder, as in Windows Explorer. Rather, their values correspond to the filter conditions defined in the query. Therefore the same device can be displayed for example at "Windows Server", as well as at "Virtual Machines". 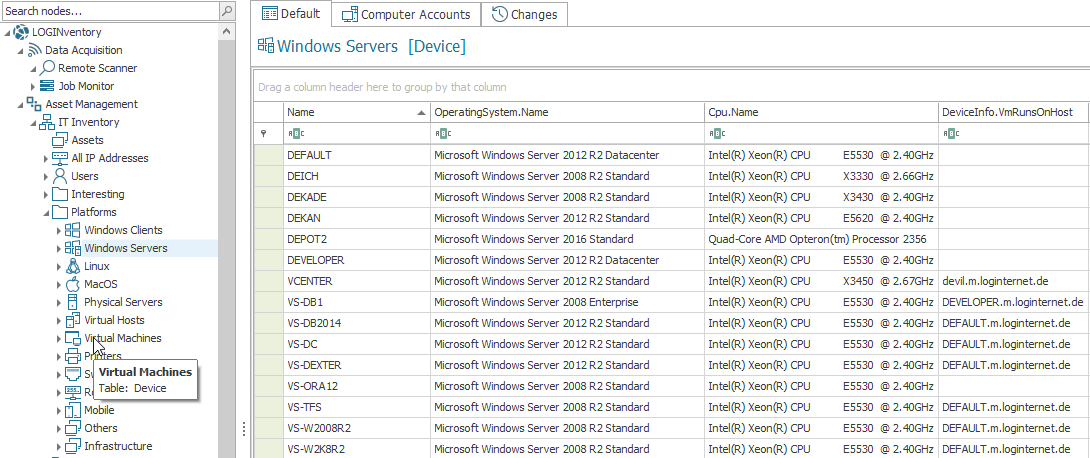
Navigation
In the left tree, navigation is done by simply clicking on a node. If available, subnodes or corresponding data are then displayed in the view on the right.
Info
Please note that a simple click on the arrow next to a node (e.g. Assets) will only display the subordinate nodes if their number is below the limit that is defined in the settings. By default, this is set to the value 200. The icons of the nodes are displayed slightly transparent if they are dynamically generated nodes. In contrast, the icons of folders and queries are displayed normally.
Details of the data displayed on the right can be shown by double-clicking a data record. If, for example, you double-click a PC in the Assets node, all details of this PC will be displayed; if you double-click a single software package in the Software / Software Packages node, all computers on which this package is installed will be displayed. For each node, you can also optionally specify whether dynamically generated nodes are to be displayed. This is possible for each node via the Node Properties. By default, the display of dynamically generated nodes is enabled only for the Asset node.
With the arrows on the top of the LMC you can - like with a web browser - navigate back to the last selection or forward.
Search Nodes
All nodes below the Asset Management node can be searched using the search function.
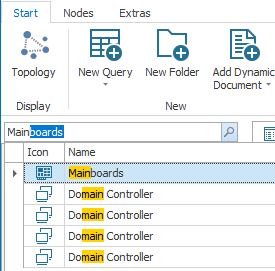
To do this, simply enter the corresponding search term (e.g. "user") and all node names that contain the term will be displayed. A click on a node from the preview results in a jump directly to this node.
Reset Node
If the node no longer fulfills the required function due to the changes made, it can be reset to the delivery state using the Reset function from the context menu. The node properties are also reset. Subnodes are not affected.
Filtering and Sorting
In the right-hand data area, the information is always displayed in the form of lists. Column headings can be simply clicked to sort the content; another click inverts the sort order.
In the filter bar below the column header, you can easily define filter conditions by simply entering a text. This is interpreted as "contains this expression".
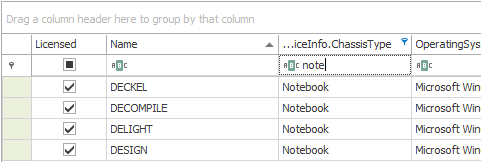
If the entered expression is to be filtered differently, another option can be selected by double-clicking on the symbol next to the filter bar.
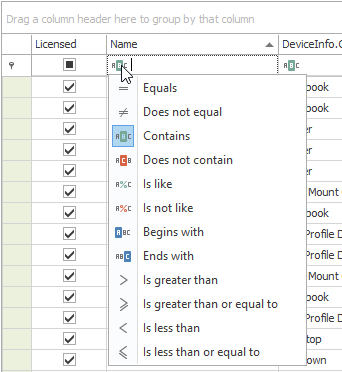
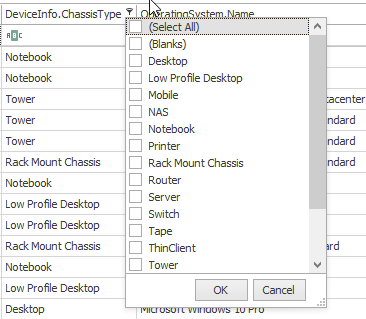
If the mouse is moved to the upper right corner of a column heading, the symbol for extended filter options appears - clicking on it displays a selection list based on the currently available values, which makes further suggestions for filtering.
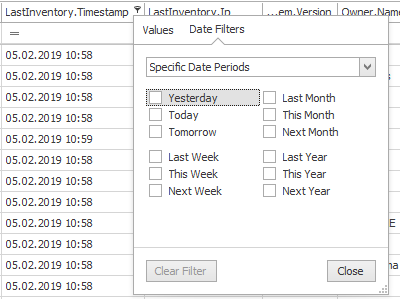
Depending on the selected column, different filter types can also be available, e.g. to filter date values.
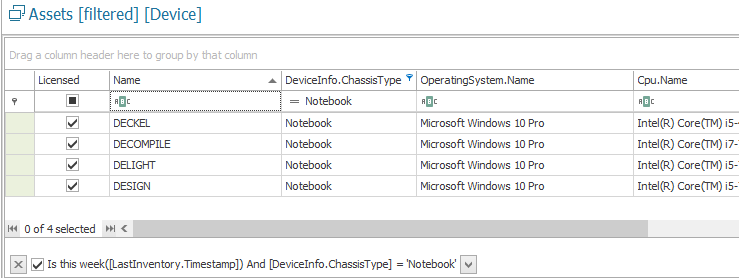
Changes to the data layout, e.g. column width and sequence as well as filter conditions, are automatically saved for the respective user. By clicking on Reset to default in the upper right corner of the data area, all individual changes for the current node can be removed. Possibly saved filters are not displayed at the top of the filter bar, but at the bottom of the data area; in addition, [filtered] is displayed in the heading as a hint.
The pull-down menu can also be used to display and select previous filter conditions; to completely delete the current filter condition, click on the [X] at the beginning of the condition.
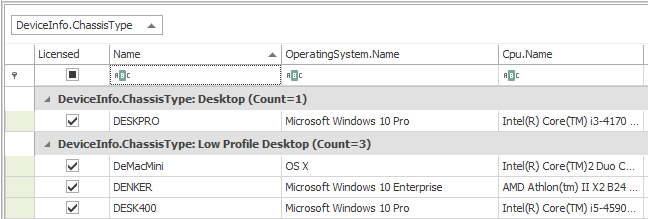
Group
The upper part of the detail view contains an area that is used to group the data in the detail view.
To activate Group Mode, drag and drop the column header of the property column you want to group by into this area. Of course, you can group according to different properties! By default, the grouped data is displayed expanded in the detail view as soon as the grouping mode is activated. By right-clicking on the column name after grouping, further options are available.
To exit the grouping mode, drag the column name back to the detail view or use the Ungroup function of the context menu.
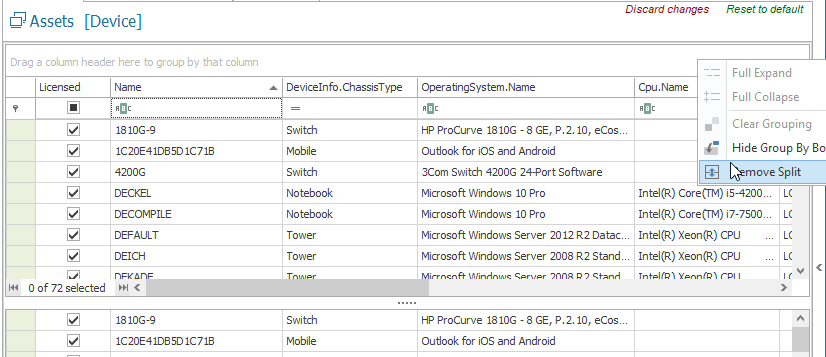
Split Result View
To split the view into two independently scrollable areas, right-click in the area above the column headings to select the Split option.
Widgets
Widgets can be used to display data and values associated with the current selection in the result view. Widgets can be opened and closed using the small arrows at the bottom and right. The widgets User Account, Computer Account, and Related Data are for information purposes only and display the associated information, whereas the widgets Custom Properties, Journal and Documents allow information to be stored by the user.
Store Your Own Values and Files
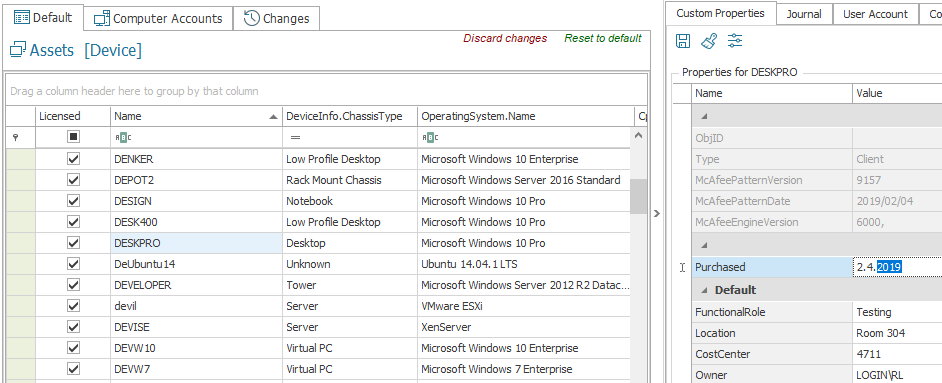
Custom Properties
In the Custom Properties, values can be displayed and edited that are not read out by the standard acquisition of devices. The properties FunctionalRole, Location, CostCenter and Owner are delivered by default and can be filled by the user. The stored property is always linked to the selected device.
Info
If several devices are selected (e.g. by using the shift or control key), the properties of several devices can also be edited simultaneously.
Linking Assets to Users
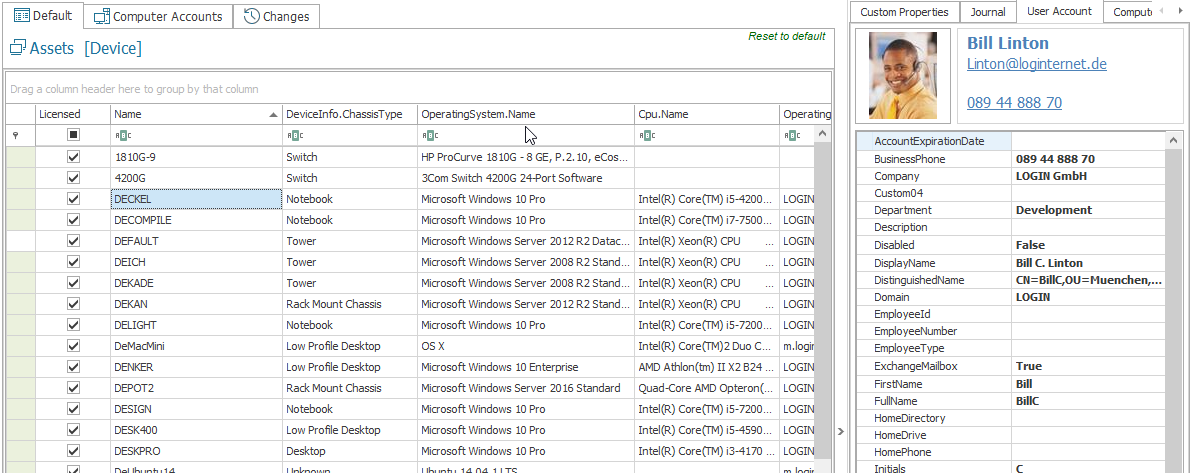
The Owner property is automatically prefilled with the user who was the last logged in user when the device was first detected, and can be overwritten. This property is used to assign devices to users. The assigned devices of a user are then also visible in the corresponding reports and queries.If you want to know who the last logged on user was at a device, use the property DeviceUsage.LastUser.Name. This property is updated with each new acquisition.
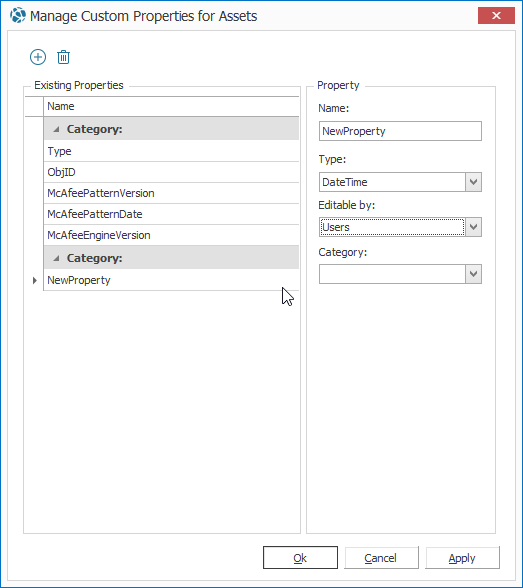
New properties can be created using the widget's settings icon. The types DateTime, Decimal and String are available for this purpose. The properties can also be divided into categories. You can also set whether the property can be filled by the user or by the scanner or agent (see Creating your own properties when capturing).
If a new property has been created here, the property field is available for all entries in the table and can be filled. If a property is deleted, the stored values are also deleted for each entry!
Info
All values stored here can of course also be used in your own queries! This makes it possible, for example, to evaluate the devices for which the warranty will expire within the next 30 days (storing the "End of warranty" property), to split the warranty according to room number, etc.
Important
In many other places, custom properties can also be useful. For example, hotfixes can be classified into "important" and "unimportant", software packages can be divided into categories (e.g. "freeware", "driver", "fee required") or tagged as "unwanted", and much more.
Documents
In LOGINventory any files, folders and links can be connected to folders and queries in the tree structure and to items in the data view. This feature is suitable, for example, to store invoices and purchase documents directly on clients, to manage exports of the server configuration to the corresponding node or to conveniently link the software license documents in license management.
Important
When storing files, you can select whether the files should only be linked, or whether the files should be stored directly in the LOGINventory database.
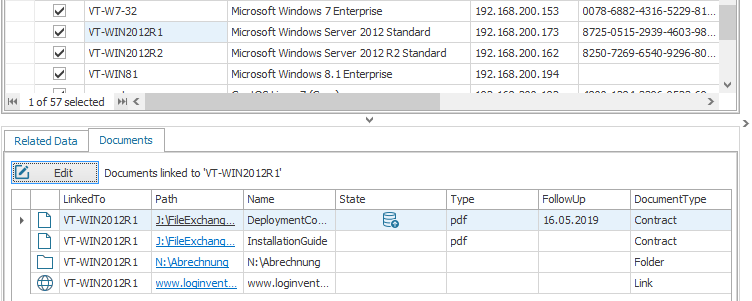
Using the Documents widget, you can add any number of files, folders and links to the currently selected item (in the tree structure or in the results list).
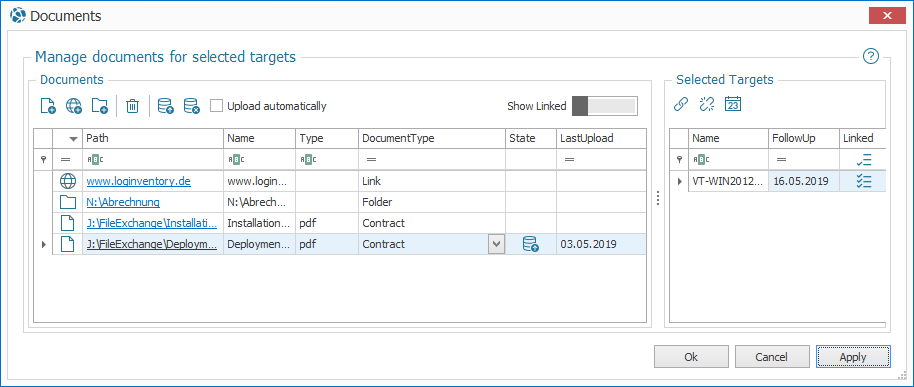
If you are storing files, they can be saved in the database. This means that the stored document can still be retrieved, even if it is removed from the original storage location. You can also set the checkbox so that future added files are automatically saved in the database. Of course, this does not apply to folders or links.
A double click or STRG + click on the pathname opens the corresponding document directly. A freely definable document type (e.g. "contract", "invoice", etc.) as well as a follow-up date can be stored for each document.
Info
The icon in the "Status" column of the documents indicates whether a file has been linked or saved in the database.
Important
Several result rows can be selected in both the list of Documents and the list of Selected Targets. You can then see, for example, whether all objects are linked to all selected documents. This is indicated by the corresponding icons in the "Linked" column next to the objects. 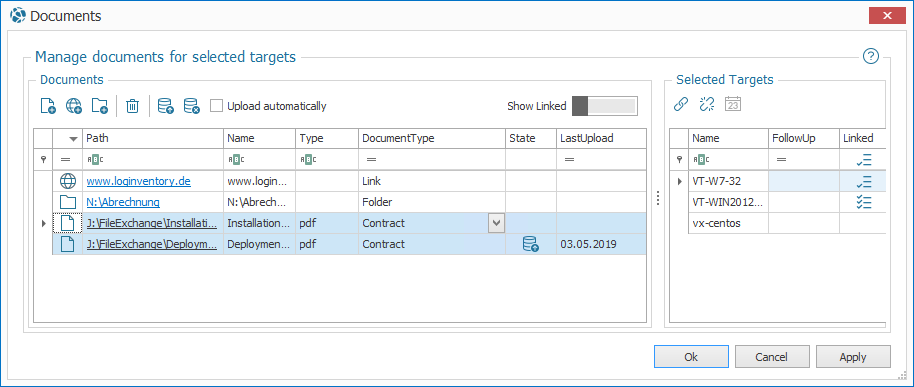
Also the follow-up date can be changed for several objects at the same time.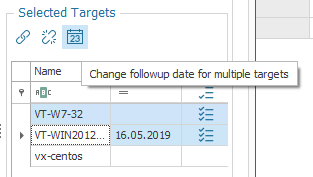
Example
If an invoice is to be linked to serveral devices simultaneously, the corresponding devices can be selected in the asset list with the shift and control keys. If you then click on "Edit" in the document widget, all deposited objects will be linked with all previously marked assets.
Info
An overview of all stored documents can be found in the node Linked Documents below Documentation in the tree structure. Here you can also filter for example according to the follow-up date. 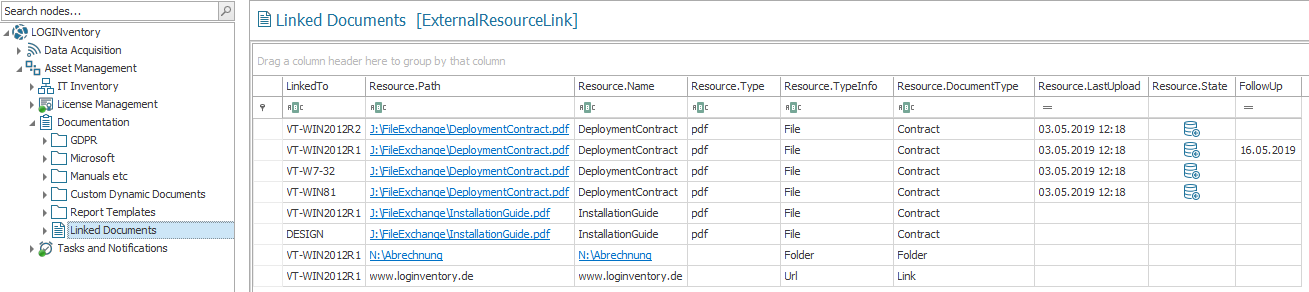
The Documents tab is also available in License Management. If possible, the corresponding proofs of purchase of licenses should be stored here directly. This makes it possible to trace the source of the figures entered for the purchased licenses and, in the event of an audit, you have these proofs quickly and easily at hand.
Tip
It is generally recommended to work with UNC paths when linking so that the call can also be made from other computers. Alternatively, the documents can also be saved directly in the database.
Journal
A journal can be kept for all assets, in which events, notes, appointments, ... are noted for the respective asset. Thus - together with the change history - the complete lifecycle of a device can be documented. For each entry, start and end date, (single-line) title (subject) and a detailed, multi-line comment (body) can be stored. New entries are entered in the lowest line by entering values.
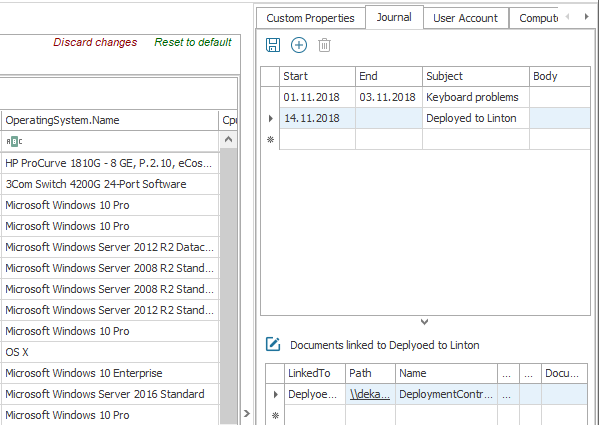
Once a line has been filled, any number of documents can be stored in the journal widget. This is suitable for storing the repair document, for example. The functions correspond to the document widget.
Display of Additional Information
User Account and Computer Account
These widgets display additional information if the Active Directory has been inventoried. For User Account, only data is visible if user name anonymization is disabled. The widgets can then display, for example, the name, email, phone number, profile picture, etc. of the "owner" of a device (see Custom Properties), or display the information about the selected device that comes from the AD Computer account.
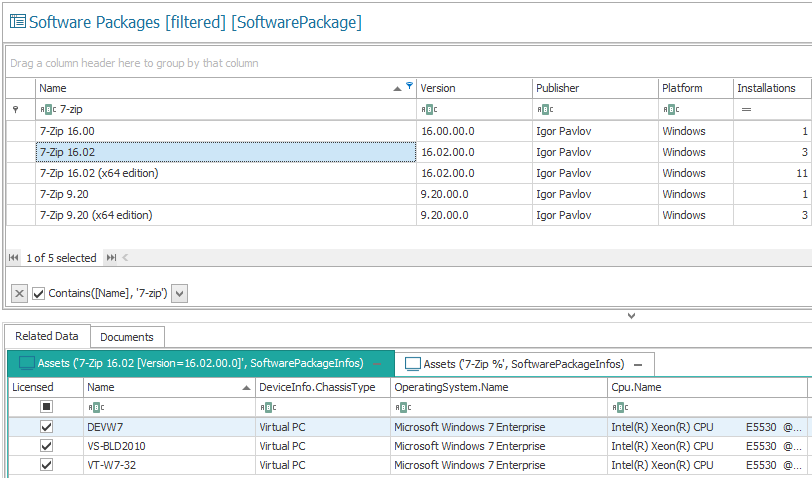
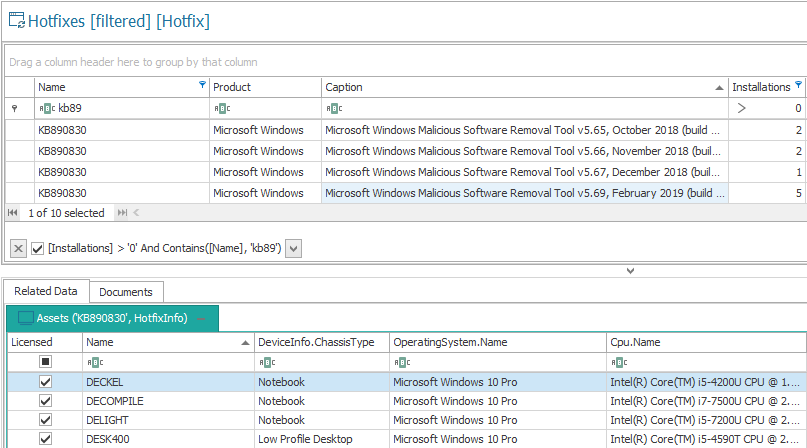
Related Data
The Related Data widget displays information associated with the selection of the results row, e.g. devices with the same hardware, devices with the same operating system, devices on which the same user was last logged in, etc.
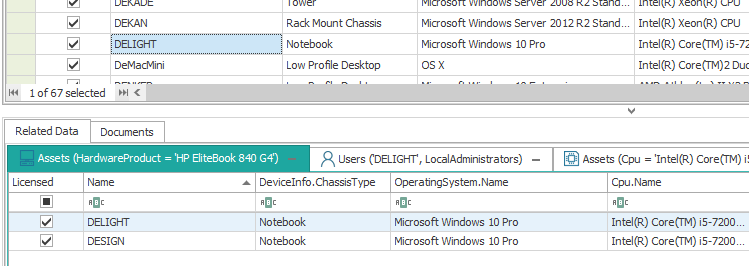
Depending on the table selected, other information may also be displayed, for example, for software packages, you see all devices that have this package installed. For AD groups, you see their members. In principle, this widget is used for quick evaluation and helps with a simple overview.
Info
In the case of software packages, there is also an additional tab available in the widget that does not filter by version. This tab shows e.g. all devices with a certain software - no matter in which version.
In addition, by clicking on the minus sign next to the respective column name in the widget, the selection can be inverted (displayed in red), whereby devices are displayed which, for example, have not installed the selected hotfix, have a different operating system, etc.
Data Analysis and Evaluation
LOGINventory already comes with a large number of evaluations (or queries) that make it possible both to obtain an overview of the entire network and to carry out detailed analyses for individual devices or installations. All provided queries can be adapted (selection of columns to be displayed, setting of filter conditions) to enable individual data analyses (see Own queries).
Important
Each successfully inventoried device is created as an asset and is visible in the Assets query. Assets can also be created manually or from incorrectly inventoried assets and imported from csv files.
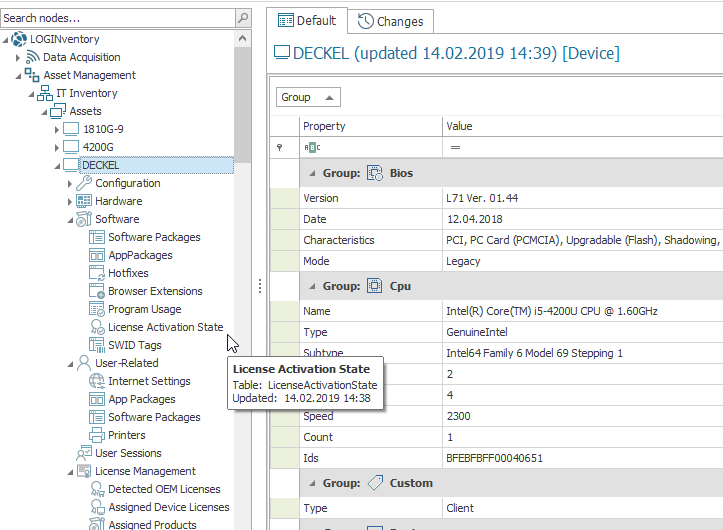
A double-click on a device creates a dynamic node below the Assets node for easy navigation between different devices. In addition, the details (all 1:1 relationships (device type, operating system, acquisition method,...) to the device) are visible in the results view. By clicking on the arrow symbol next to the dynamically generated node, the 1:n relationships (memory modules, hard disks, software packages, shares,...) to the device can be selected. The data displayed depends on the type of device.
Under All IP Addresses, all IP addresses are listed and it is possible to see which devices could be inventoried or which errors occurred with unrecorded devices.
Info
All user accounts are listed under users. If a user is selected, the assigned devices, devices on which the user has admin rights and authorizations on file system and database level are visible.
If evaluations are to be carried out for more than one device, the supplied queries in the tree structure can be used.
Explanation of the Tree Structure
The queries always refer to all successfully recorded, non-archived devices. The following folders can be found in the tree structure:
- Interesting: This folder contains queries with filter conditions that provide an up-to-date overview of interesting aspects of the network, e.g. faulty or incompletely captured devices, newly found devices, devices without up-to-date antivirus definitions, etc.
- Platforms: Queries structured by type of device or operating system (e.g. Windows Server, Virtual Hosts, Printers, Laptops). Caution: the devices displayed in the queries were not sorted manually and cannot be re-sorted, but correspond to the filter conditions defined in the query.
- Hardware: On the first level there are summaries about the hardware of all successfully registered devices (e.g. which CPU/ drive, USB device, ... is how often in use). In the Related Data widget, the respective devices with the selected hardware are visible. There are no summaries in the Query Lists folder, but detailed views in the form "Device Name + Existing Hardware". For example, the query list Monitors for each computer shows all recorded details for all connected monitors (including serial number, production week, etc.).
- Software: On the first level there are summaries about the software of all successfully recorded devices (e.g. which operating system/hotfix, software package, ... is how often in use). In the linked data widget, the respective devices with the selected software are visible. There are no summaries in the Query Lists folder, but detailed views in the form "Device Name + Existing Software". For example, the query list Product key for each computer shows all details entered for all activated software packages (including product key, installation date, installation location, etc.).
- Configuration: On the first level, there are breakdowns of the server roles available in the network.The Query Lists folder does not contain summaries, but detailed views in the form "Device Name + Configuration". For example, the Listening ports query list for each host shows all the details captured for all open ports.
- Access Rights: Among other things, the access rights to shares, shared folders and databases are displayed here. In addition, the effective permissions to Shared Folders are displayed. Attention: For performance reasons, this query is not recalculated for each selection, but only if "Recalculate on Server" is selected in the ribbon menu.
- Active Directory: All groups, accounts and computers imported from the AD and their properties are displayed here. In the widget Related Data, the members of the respective group or the memberships of the respective user are visible.
- Microsoft Exchange: Displays details of all Exchange servers, Exchange databases, and Exchange mailboxes.
- Analyses: This folder is good for creating own queries.
In addition, the first level of the IT Inventory folder contains the queries Archived Assets, Unlicensed Assets and Failed Inventory.
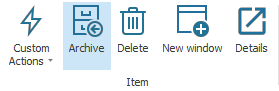
Archiving and Deleting Assets
Assets can be archived and deleted via the ribbon menu and the context menu. Archiving results in the asset being moved to the archive and thus excluded from all queries. However, the change history and the assigned properties are retained. With a valid LOGINventory license, as many active as archived assets can always be kept in the database.
If an asset is deleted, its change history and all stored properties, journal entries and documents are also lost.
In both cases, however, the following applies: If a deleted or archived asset is newly recorded, it automatically becomes an active asset again. To prevent certain assets from being created, a definition of type exclusion from inventory can be created or the capture can be modified accordingly.
Data Export and Creation of Documentation and Reports
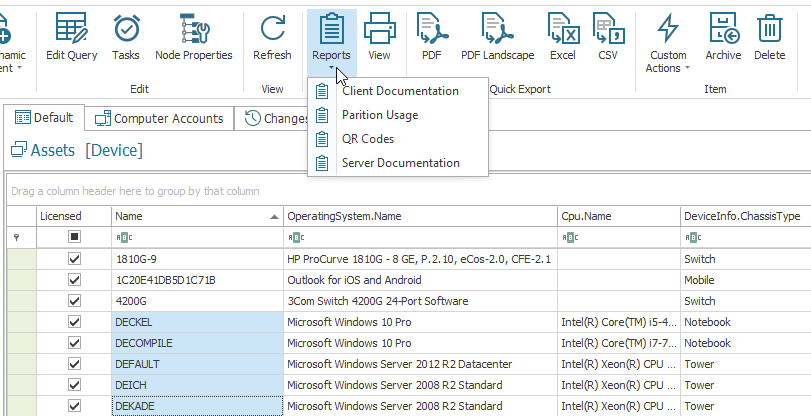
The current data view can always be exported to different formats (pdf, xls, csv) including all set filter conditions, groupings and adjustments of the column order via the ribbon menu Quick export. Via the ribbon menu Print / Advanced further settings for format, page layout, etc. can be made. Further export formats and the option to send directly by email are also available.
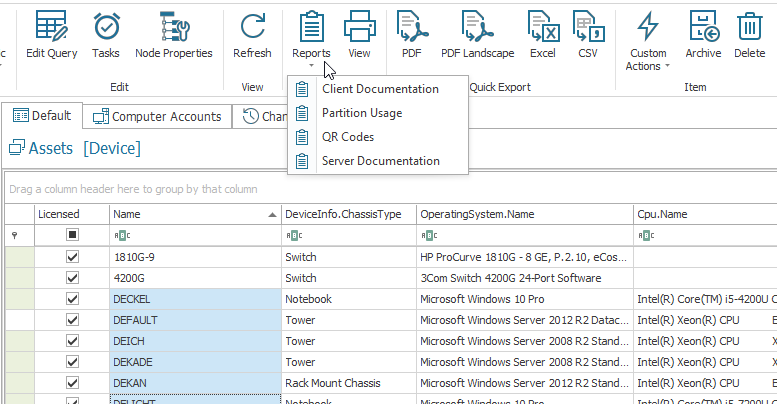
In addition, the supplied report templates can be applied to the current selection via the ribbon menu Print / Reports. This means that if a query was last selected in the tree, the corresponding report is applied to all query results. If the report is only to be applied to a selection of elements, these must first be selected in the result view using the Shift and Control keys. The report templates are still customizable and of course new report templates can be created.
In addition, dynamic documents can be created at any position in the tree using the ribbon menu.
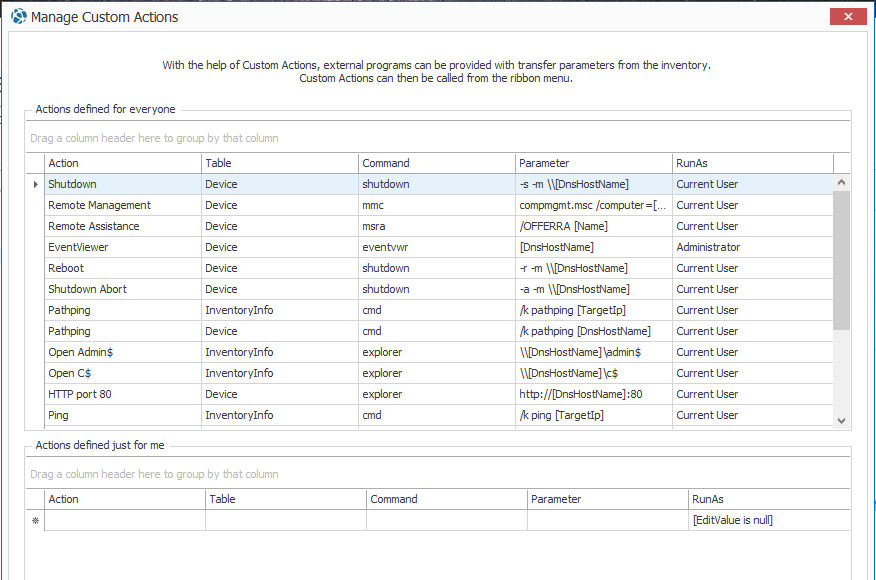
Custom Actions
From every query node in LOGINventory it is possible to start external programs and supply them with parameters from the database - if these actions have been defined here before. Depending on the table selected in the Custom Actions, the possible actions appear in the ribbon under Element / Custom Actions as soon as the corresponding entry is selected in the result view. If, for example, an asset is selected, the following actions are available:
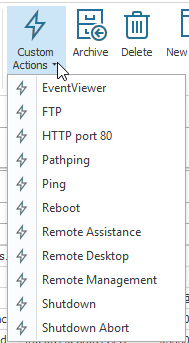
In Customizing, you can check the existing actions and create new ones by defining which command is to be available for which table with which transfer parameters.
Own Queries
All information in LOGINventory is based on queries arranged in a tree structure. Of course, users can also create their own query nodes or modify the supplied nodes.
- In principle, the (context menu) function New query can be used to create new queries at any position in the LOGINventory tree. To do this, select New query from the ribbon menu.
- For a better overview of the queries, it is recommended that subnodes are added using the New folder function. They help to classify the queries.
- If a new node is created as a subnode of an already existing query, the upper query serves as a prefilter for the new query!
- Any existing query can be edited, copied, deleted and reset to the factory default state to display the values that are of real interest.
Important
By arranging queries among each other, multi-level evaluations are possible.
Example: Filtering on the first level to a location. Positioning of a query on software packages below.
Result: Only the software packages of the respective location are displayed. Such structures can also be used multiple times in order to carry out the same evaluations for different locations.
LOGINventory generally stores all information in two table classes:
- Catalog tables contain the basic information, e.g. names of software packages or video adapters and when they were first discovered in the data acquisition process.
- Link tables contain current individual information such as e.g.
- for software packages, installation date and location, license key, product ID, etc.;
- for video adapters, the driver version, RAM size, etc.
Info
Link tables link the underlying catalog table to the information of the device (asset). Names of link tables always end with "Info".
In principle, the procedure for creating new queries is as follows:
- The properties that are of interest are selected from the list on the left. The filter and grouping functions can be used to find the desired property faster.
- The base table, which links the different tables, is automatically adjusted depending on the selection.
- A preview of the results is displayed in the lower part of the view.
- Filter conditions can also be set to further restrict the result list.
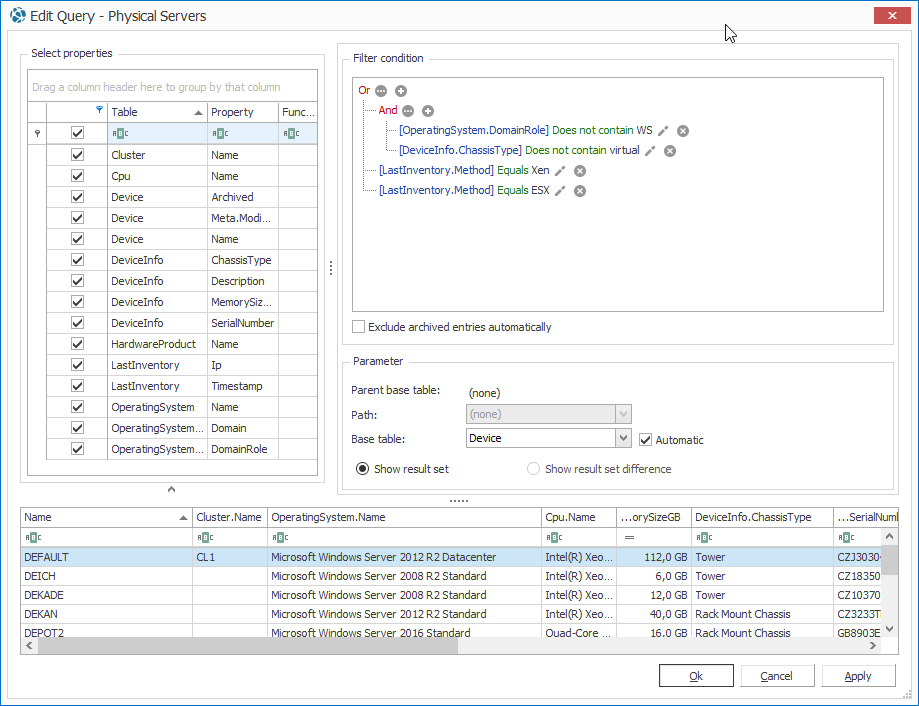
- Depending on the columns selected, the path between the tables can sometimes be adjusted, as shown in the following example.
Example for the adjustment of paths
If the owner of the device is also to be displayed in a new query for a device, you can select Device.Name as well as User.Name. Then different paths are available, via which the table "Device" can be linked with the table "User". For example, the owner can be displayed ("Owner"), the last logged in user ("DeviceUsage.LastUser"), users who have been assigned device licenses ("DeviceLicenses.UserAccount.User"), and much more. 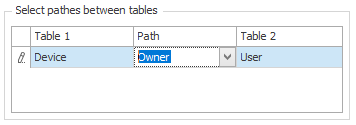
If desired, only a base table can be selected in the query editor and no properties can be selected. This displays the corresponding base table. For example, the Software Packages node is only a query where the base table SoftwarePackage has been selected.
Info
In general, own queries serve to make frequently required evaluations directly available without having to set filter conditions in the existing queries. Typically, own queries contain e.g. sorting by location or IP subnet, temporal filtering on warranty or purchase date, or evaluations on which notifications are to be set.
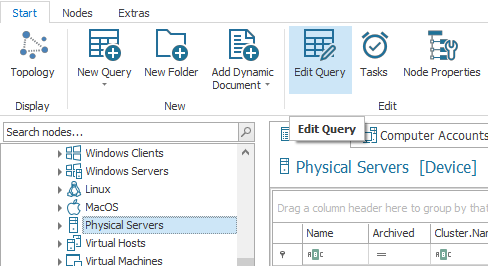
For example, to display additional columns in the Assets list (such as Custom Properties), you can select "Edit Query" from the ribbon menu on the Assets node, and also select the desired columns on the left. After closing the Edit window, the additional columns will be available in the Assets list.
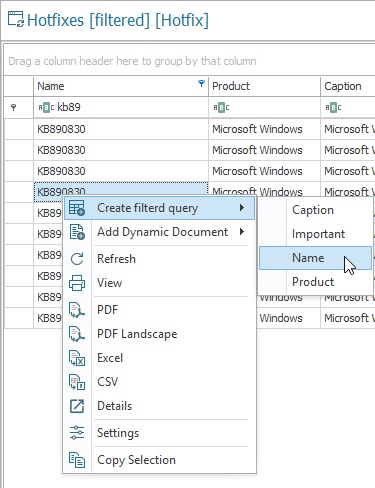
In order to quickly create another query with a filter condition (e.g. filtering for hotfix names) below an existing query (e.g. hotfixes), the Create filtered query function can also be selected via the context menu. The column to be filtered can then be selected. In this example, the progress of the hotfix rollout can be checked quickly and easily with just one click.
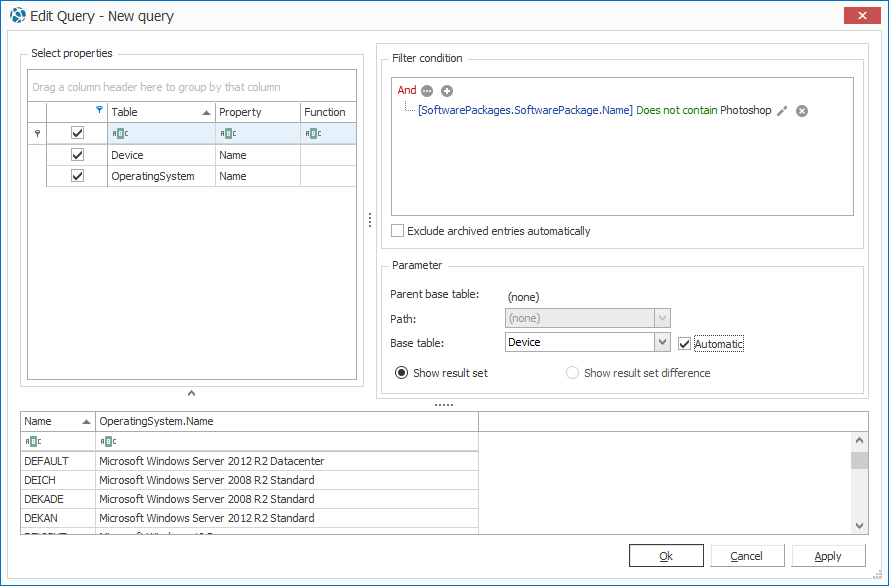
List of Computers on Which a Software Package is not Installed
- Creating a New query (for example, below the Analyses node)
- Either selection of the base table device (bottom right)
- or selecting the columns of interest (e.g. Device.Name and Operatingsystem.Name)
- Add a filter condition (top right):
SoftwarePackage.name does not contain "Adobe Photoshop". - Rename the query to "Computers without Photoshop" by double-clicking on the query name.
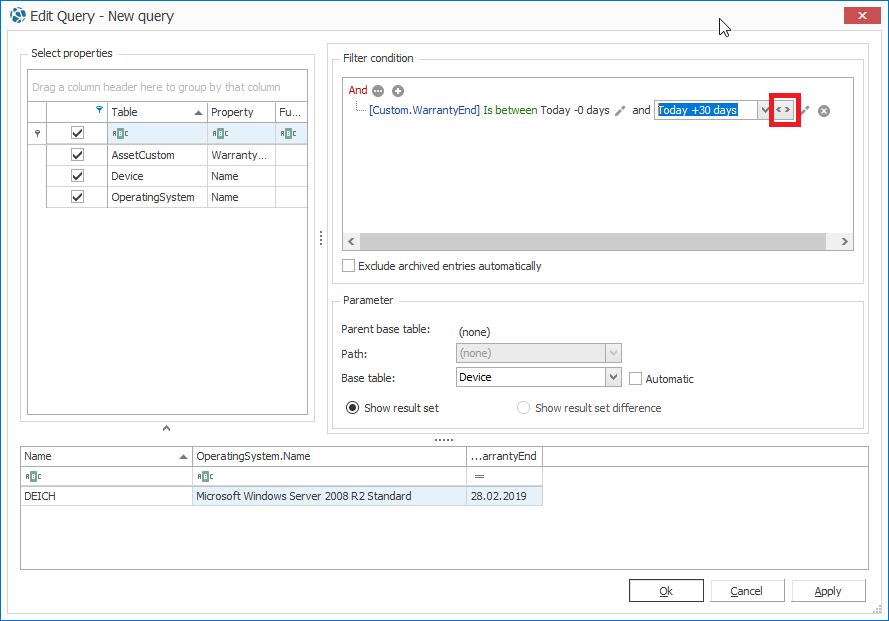
List of Computers Where the Warranty Expires Within the Next 30 Days
Prerequisite: Create a "End of warranty" property and fill it with values for the respective devices.
- Creating a New query (for example, below the Analyses node)
- Either selection of the base table device (bottom right)
- or select the columns of interest (e.g. Device.Name, Operatingsystem.Name and AssetCustom.WarrantyEnd)
- Adding a filter condition (top right):
Custom.WarrantyEnd is between Today -0 days and Today +30 daysNote: by clicking on the arrow symbol (left or right) you can work with relative values likeToday+30 daysfor DateTime entries. - Rename the query to "Warranty expires within the next 30 days" by double-clicking on the query name.
Tip
To receive a monthly email with the list of affected computers, a Task can be positioned on this node via the ribbon menu.
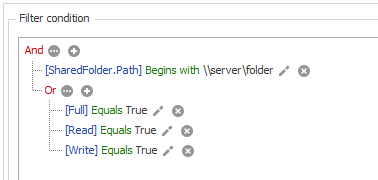
List of Users Who Have Access to a Specific Folder
- Creating a New query (for example, below the Analyses node)
- Selection of columns User.Name, SharedFolder.Path, SharedFolderUserInfo.Full, SharedFolderUserInfo.Read and SharedFolderUserInfo.Write
- Add a filter condition: Drag and drop the column name "SharedFolder.Path" from the property selection to the filter area:
SharedFolder.Path starts with \\Server\Folder. - Add another group to the filter conditions by clicking on the three points and selecting the operator
orfor this group. - Add filter conditions
Full equals true,Read equals trueandWrite equals true. - Rename the query to "Access \\Server\Folder"
Editing Nodes and Adjusting the Tree Structure
Nodes can be
- moved to another position in the tree using Drag & Drop,
- renamed by double-clicking on them,
- reset to the delivery state via the context menu,
- duplicated,
- copied
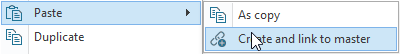
- pasted as a copy,
- pasted as a link to the master (node that was copied). As a result, all changes below the original (adding further nodes, etc.) are also copied from the linked node.
- exported and saved as .ndef,
- imported (from a .ndef file).
Node Properties
A right click on a node (folder or query) opens the node properties under Edit.
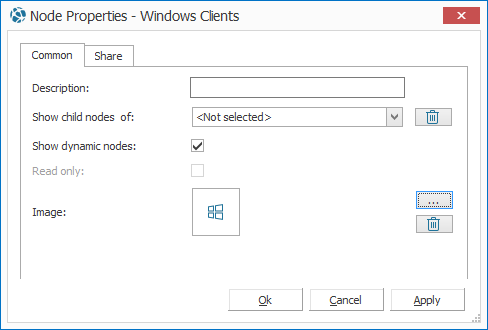
A description can be stored here, you can define from which node the subnodes are to be displayed, and you can select whether dynamic nodes are to be displayed. In addition, a separate icon can be stored for each query. There are already several icons to choose from and you can also add your own. The recommended resolution is 16 x 16 pixels.
In the tab Share the node (including all subnodes) can be shared. Read more here.
Multiple Use of Query Structures
In order to be able to use a created structure several times in LOGINventory, there is a very useful possibility by linking to a master structure. Using a symbolic link, the queries of a structure can be mirrored. This means that a link is created to an existing master structure.
All changes to the master structure are mirrored by symbolic links to the linked structures. Changes are only possible to the master structure. This is particularly suitable for the use of centrally managed structures at different company locations.
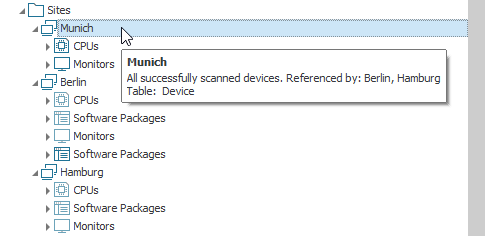
Thus, if in this example another query is added below the "Munich" node, it will automatically be available below the "Berlin" and "Hamburg" queries.
Change History
For each table, you can specify whether changes are to be logged or whether only the current status is available. By default, change history capture is already enabled for most tables, but can be customized via Settings.
If the changes are entered for a table, the Changes tab is available.
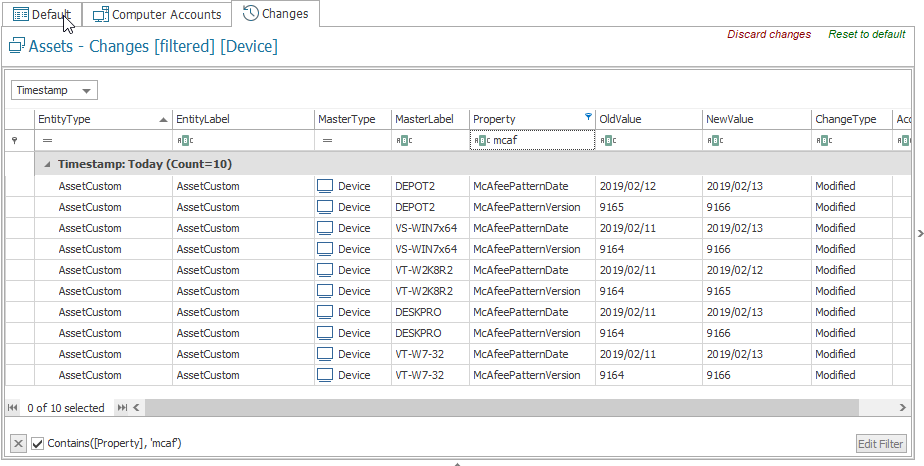
Depending on which query or node you are on, only the changes for the query results are displayed here. So if you want an overview of all changes in the network, you should look at the change history for the Assets node. However, if only the changes to a specific device are of interest (e.g. for troubleshooting), the device can first be selected by double-clicking and then switched to the Changes tab. In the change view itself, you can of course filter, group, etc. as usual in order to access the information that is of interest.
Network Topology View
LOGINventory offers the possibility to graphically display the network topology. To do this, a node whose base table is "Device" must be selected in the tree view. Then the network overview can be viewed via the ribbon menu Display / Topology. In order to have a graphical representation of all recorded devices, the Assets node should first be selected.
If the topology has been determined, it is displayed in a graphic. It is a vector graphic with active objects, which allows editing by the user:
- Zoom function (using the mouse wheel): The graphic is zoomed to the current mouse position.
- Move assets within the graphic (e.g. connections can be sorted by port number)
- Select the objects; a double-click on an element selects the entire attached net.
- The device data is displayed for each selected object.
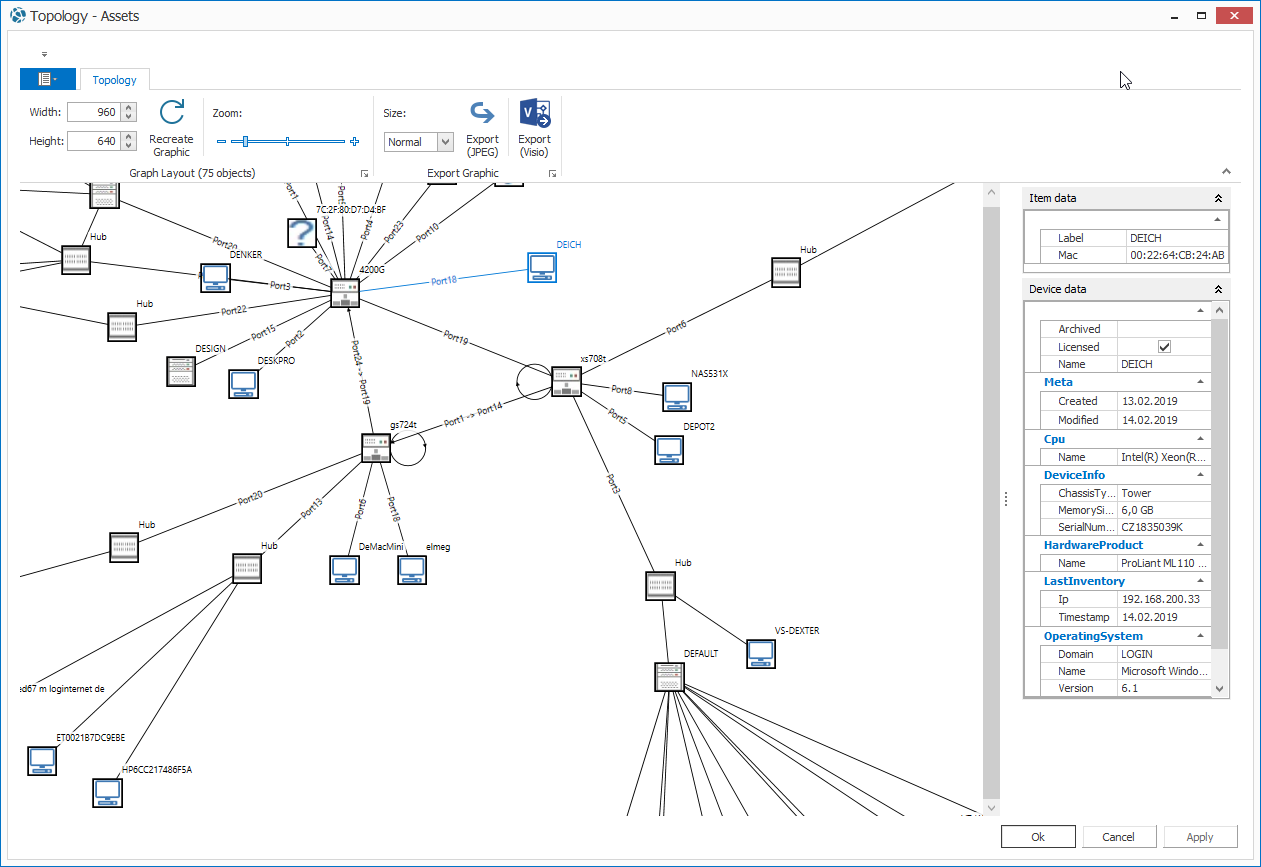
Each asset node in the displayed topology can be selected to read its information. The information displayed varies depending on the status of the asset:
- Basic information is available for each asset. It contains the name and Mac address of the asset.
- Data (Device): The data to be displayed is determined by properties from the parent asset query (see below).
- Data (VmGuest): The data is read from the VM host.
- Data (InventoryInfo): Inventory data of not successfully scanned devices.
The graphic can then be exported as JPEG and in Visio format (at least MS Visio 2013 is required on the LOGINventory computer).
Tip
If you do not have Visio installed on your LOGINventory computer, you can simply use the portable LMC on a computer with Visio installed.
In the Settings you can define whether unsuccessfully inventoried devices should also be displayed in the view.
Other Views
Depending on the selection, the Dashboard, Computer Accounts, or User Accounts views may also be available.
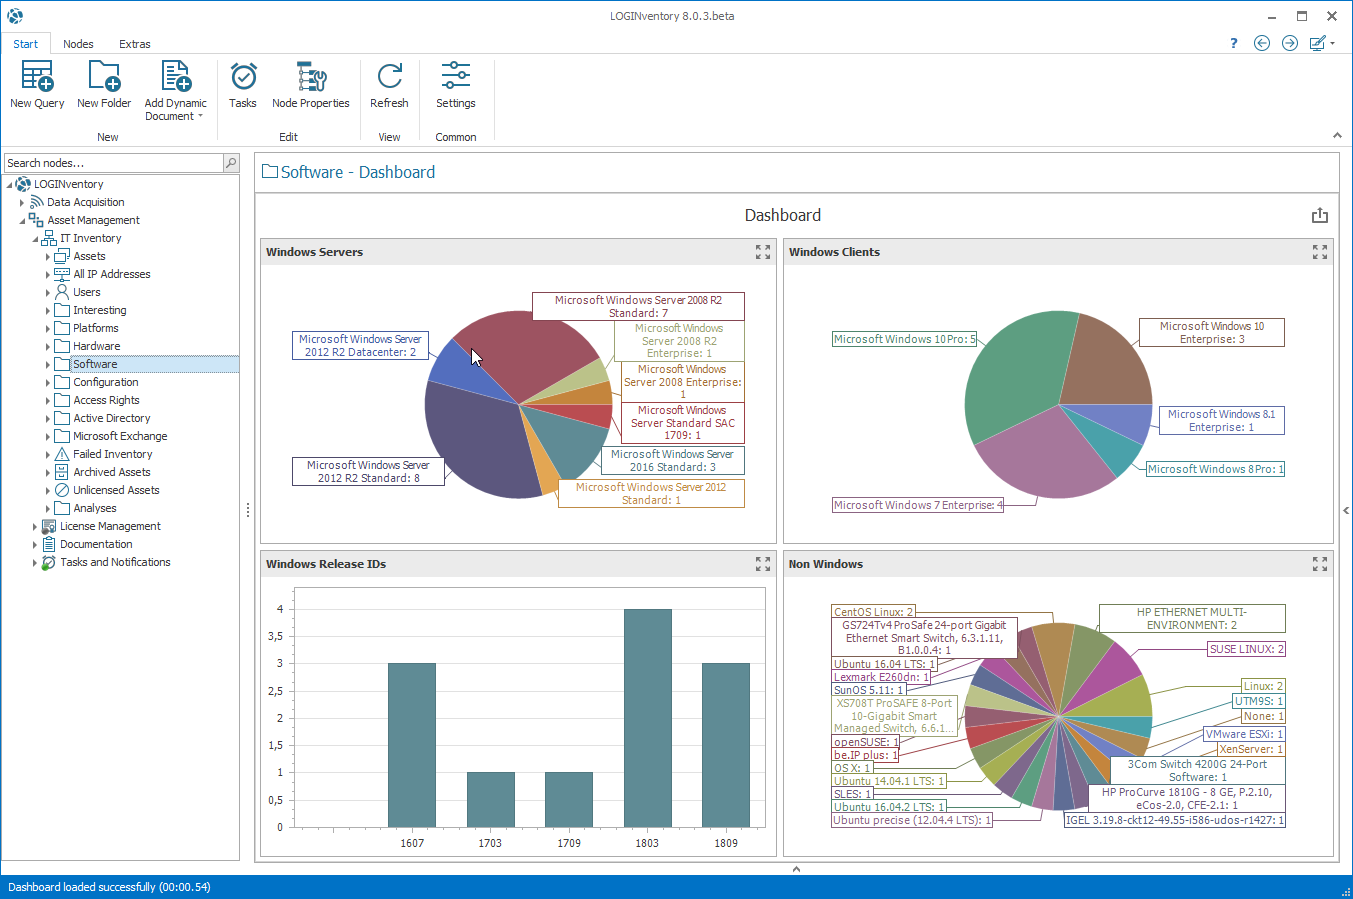
View Dashboard
In Dashboards, data from the inventory is displayed graphically.
View Computer Accounts
The Computer Accounts view is available for all queries with the base table "Device". The inventory data is displayed linked with the corresponding data from the Active Directory (Device.Name ↔ Account.Name). This makes it easy to see,
- which devices are present in the AD, but not in LOGINventory (no entry in Device.Name)
- which devices are not present in the AD, but still in LOGINventory (no entry in Account.Name)
- which devices are deactivated in the AD, but are still present in LOGINventory
- etc.
View User Accounts
The User Accounts view exists only in the predefined Users node. The users detected during the inventory are displayed linked with the corresponding data from the Active Directory (User.Name ↔ Account.Name). This allows you to identify, for example, which accounts are not in the AD.
Customizing
LOGINventory can be easily adapted to your needs with the help of customizing.
Custom Actions
From every query node it is possible to start external programs and supply them with parameters from the database - if these actions were defined here before. External programs, e.g. helpdesk systems, can be connected via this interface.
Depending on the table selected in the Custom Actions, the possible actions appear in the ribbon menu as soon as the corresponding entry is selected in the results view. If, for example, an asset is selected, the supplied actions for Remote Management and Remote Desktop, etc. are displayed. These can then be applied to an asset.
When creating new actions, you can specify whether the actions are to be available for all users or only for the current user.
A Custom Action consists of
- the name of the action
- of the table to which the action refers
- the command to be executed
- parameters that are to be passed
- and a user to execute the action (RunAs)
Example
To define a new action "Wake on LAN", the command MagicPacket.exe -mac <MAC-address> must be executed. To do this, select MagicPacket.exe from the command and enter -mac [LastInventory.Mac] as the parameter.
After creating a new action, it may be necessary to restart LOGINventory.
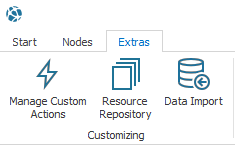
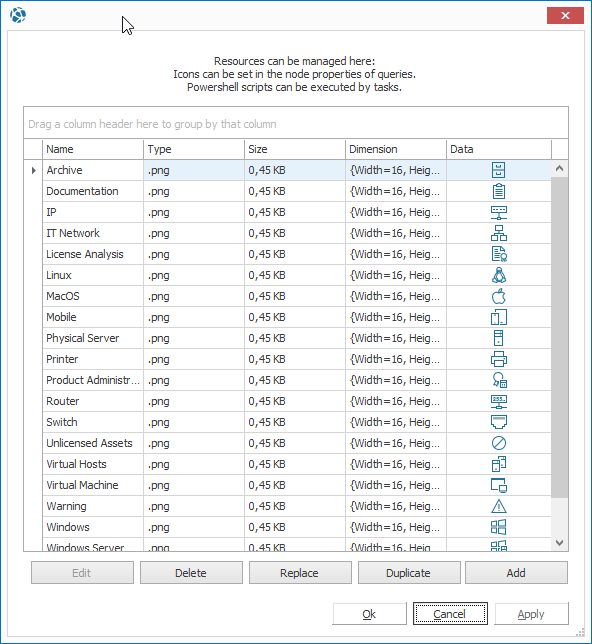
Resource Repository
Files that belong to the Resource Repository are managed in the database and are available at different places in LOGINventory. By default, various png files already exist that can be used to assign another icon to a query. In addition, Powershell scripts that were deposited with the Tasks appear here. If these scripts are adapted here, this adaptation applies to all tasks that refer to the respective script.
Data Import
Data can be imported from csv files using the data import function. This can be used, for example, to manually create assets, fill in your own properties or import licenses. The data import is described in detail here.